ipyleaflet - Interactive Maps in Python based on leaflet.js
Python has a list of libraries for plotting maps in jupyter notebook like geopandas, folium, bokeh, bqplot, cartopy, etc. The ipyleaflet is one such library which provides easy to use interface for plotting various kinds of maps with different base tiles. The ipyleaflet is built on top of leaflet.js and ipywidgets. As ipyleaflet is based on ipywidgets which means that individual components of maps can be modified dynamically and it'll result in updating maps. We'll be discussing the usage of the ipyleaflet library for plotting various maps. If you are interested in learning other python libraries for plotting maps then please feel free to refer to the references section for tutorials on other python libraries for plotting maps.
We'll start by importing necessary libraries.
import pandas as pd
import numpy as np
Creating Simple Map
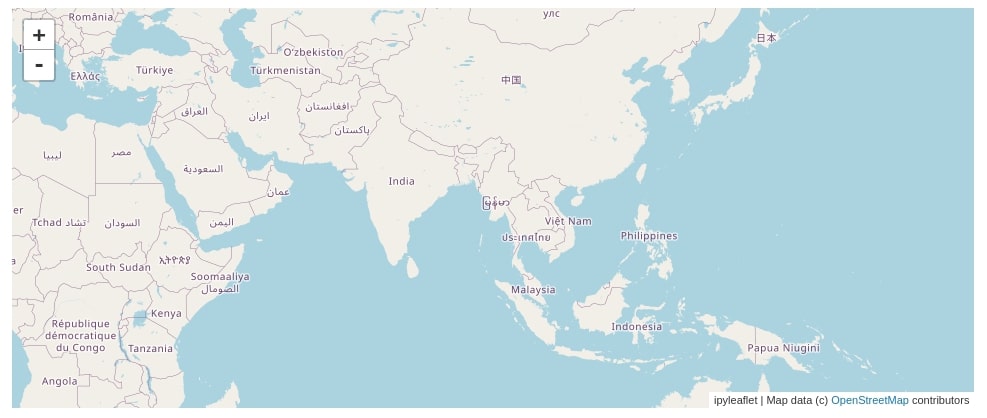
The simplest way to create a map with ipyleaflet is by just creating an object of class Map(). It'll create a default world map with OpenStreetMap.Mapnik tile as a base map. We can set the center attribute with a tuple consisting of latitude and longitude telling it where to center the map. We can change different zoom levels by setting the zoom attribute with values between 1-15. The value of 1 will result in no zoom and the value of 15 will result in maximum zoom.
from ipyleaflet import Map

lat, lon = 18, 95

m = Map(center=(lat,lon), zoom=3)

m
Trying Various Base Maps
We can access basemap used for creating maps in ipyleaflet by calling basemap attribute on the map object. Below we can see that when we called basemap on the map object it shows us that the default basemap is OpenStreetMap.
m.basemap
We can change the default basemap by setting other base maps available in ipyleaflet. We can access all base maps available in basemap using the basemaps module of ipyleaflet. Below we have printed a list of tiles available with OpenStreetMap basemap.
The list of total basemaps available with ipyleaflet are available from this link:
from ipyleaflet import basemaps

basemaps.OpenStreetMap
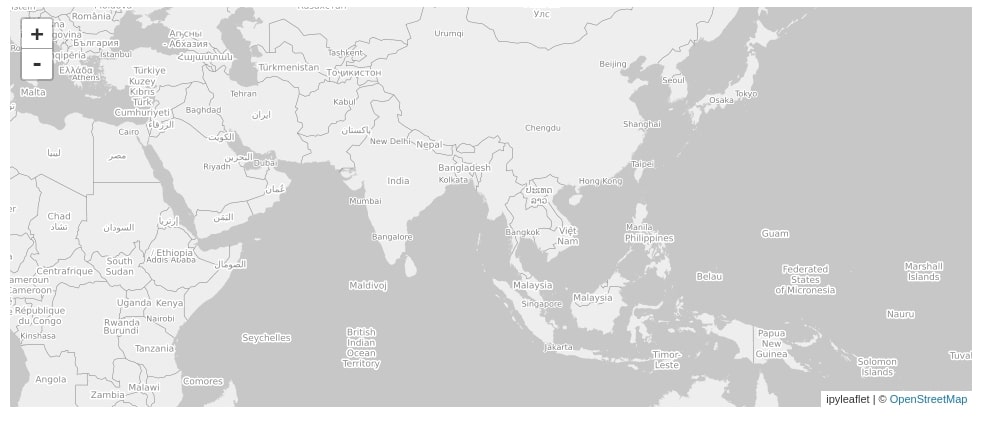
Below we have explained a simple example where we have changed the default basemap from OpenStreetMap.Mapnik to OpenStreetMap.BlackAndWhite.
m = Map(center=(lat,lon), zoom=3,
        basemap=basemaps.OpenStreetMap.BlackAndWhite)

m
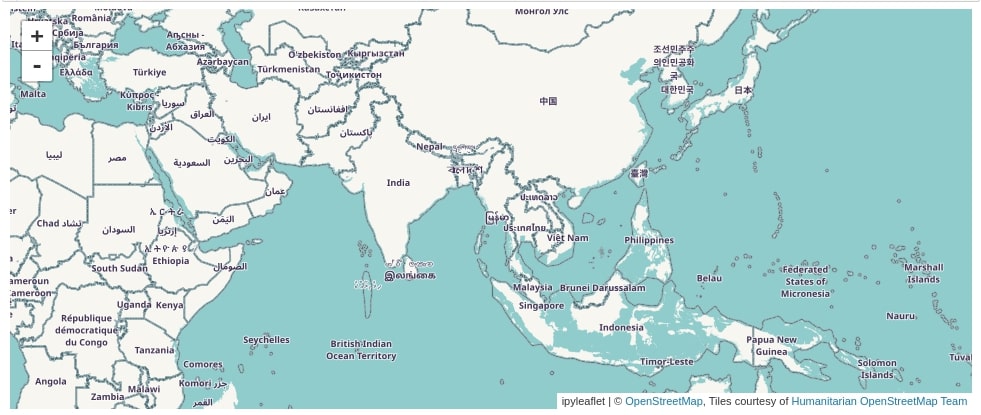
Below is another example where we have set basemap to OpenStreetMap.HOT.
m = Map(center=(lat,lon), zoom=3,
        basemap=basemaps.OpenStreetMap.HOT)

m
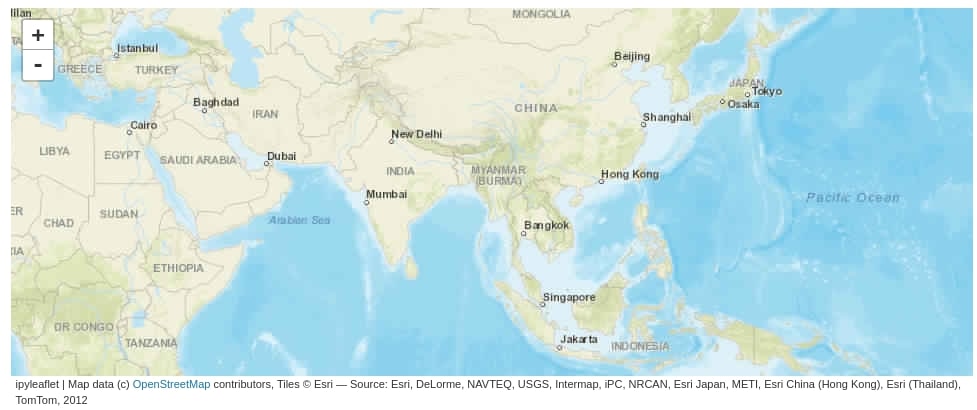
We can change the base map even after the map is created. We can call the add_layer() method on the map object passing it basemap name as argument. The below example demonstrates how to do it by setting basemap to Esri.WorldStreetMap.
m = Map(center=(lat,lon), zoom=3)

m.add_layer(basemaps.Esri.WorldStreetMap)

m
Saving Map to HTML
We can also save ipyleaflet maps using the save() method of the map objects. Please make a note that we can save ipyleaflet maps only as HTML files.
m.save("map.html")
Adding Markers, Icons & Popup Messages
We'll now explain how to add various types of markers, icons, and pop-up messages to maps. We'll load Indian census data for various districts of states. The dataset is available from kaggle.
Please feel free to download datasets to follow along.
district_wise_population = pd.read_csv("datasets/indian-census-data-with-geospatial-indexing/district wise population and centroids.csv")
district_wise_population.head()
Below we have created another dataframe that will have information about districts of only one state (Gujarat) of India. We'll be using this dataset for plotting various districts’ locations on maps.
guj_districts_pop = district_wise_population[district_wise_population.State == "Gujarat"]
guj_districts_pop
We can create a marker in ipyleaflet using the Marker() constructor available. We need to pass the location of the marker as a tuple of latitude and longitude and it'll create a marker on the chart on that location. We can also pass a string that will appear as a popup when the mouse is dragged over that popup using the title attribute of Marker(). By default, the marker can be dragged from one location to another, but as we don't want it to move we have set the draggable attribute to False.
We can add a marker to the map by creating markers and then calling the add_layer() method on the map passing it a marker.
Below we have created a map where there is a marker on all district locations of the state of India. As the ipyleaflet map is ipywidgets widget internally, we can apply various styles to it. Below we have changed the height of the map by setting the height attribute of the layout of the map.
from ipyleaflet import Marker

m = Map(center=(23,72), zoom=7, basemap = basemaps.Esri.WorldStreetMap)

for name, lon, lat in guj_districts_pop[["District", "Longitude", "Latitude"]].values:
    marker = Marker(location=(lat, lon), draggable=False, title=name, alt=name)
    m.add_layer(marker)

m.layout.height="550px"

m

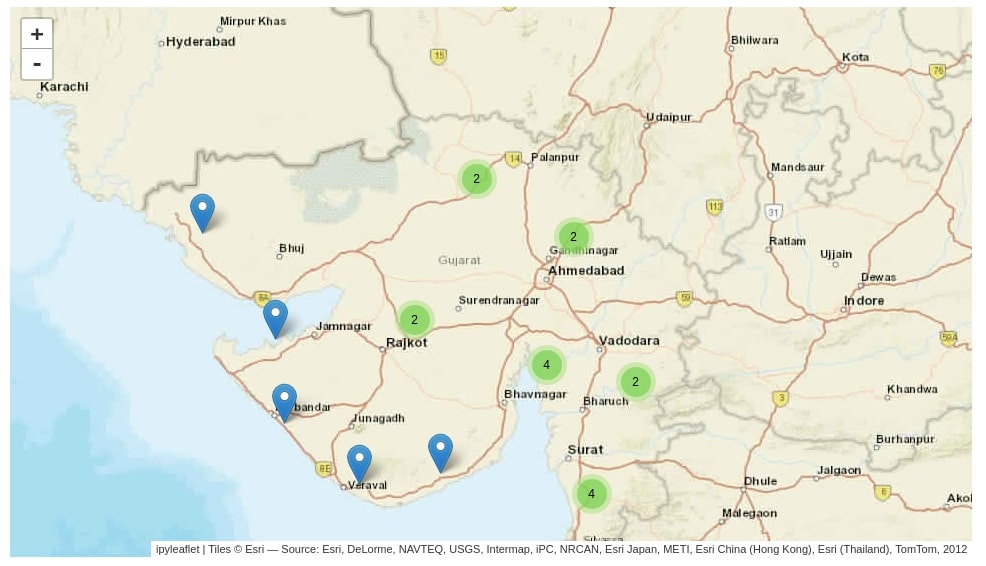
We can create clusters of markers using the MarkerCluster() constructor available from ipyleaflet. If we need to add too many markers to the chart which can result in making the chart look crowded then its advisable to use MarkerCluster to create a cluster of markers. It'll group clusters based on location and when clicked on that cluster of markers, it'll zoom into that location and expand markers.
Below we have explained the usage of MarkerCluster where we are creating a cluster of all markers first and then adding them to the map.
Please make a note that we have used different basemap each time we draw a map to show different basemaps available with ipyleaflet.
from ipyleaflet import MarkerCluster

m = Map(center=(23,72), zoom=7, basemap = basemaps.Esri.WorldStreetMap)

markers = []
for name, lon, lat in guj_districts_pop[["District", "Longitude", "Latitude"]].values:
    markers.append(Marker(location=(lat, lon), draggable=False, title=name, alt=name))


marker_cluster = MarkerCluster(markers=markers)
m.add_layer(marker_cluster)

m.layout.height="550px"

m
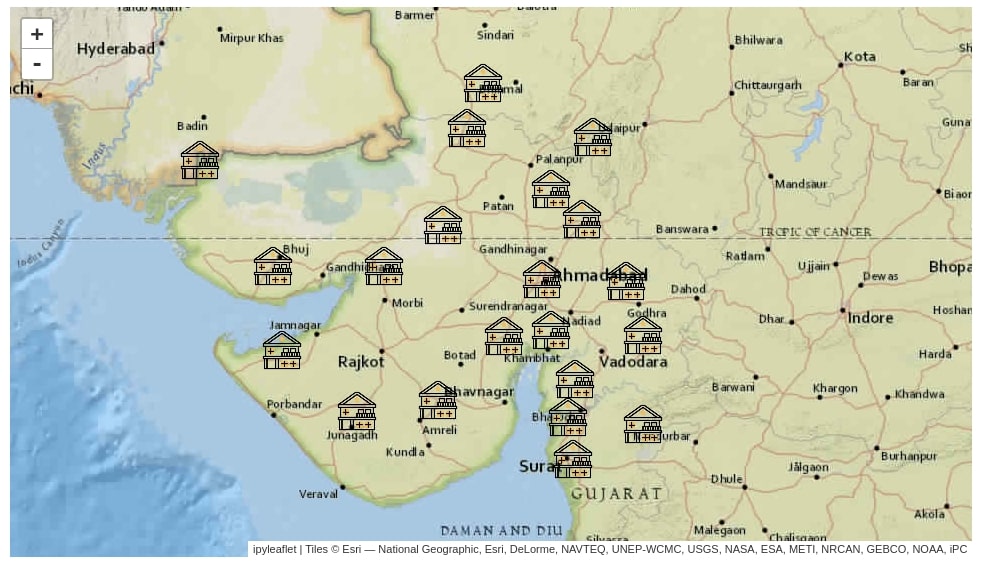
The ipyleaflet also lets us change the default icon of markers available. There are different situations when we want to use different icons then available with ipyleaflet. We can create an icon by using the Icon() constructor available from ipyleaflet. We need to pass it the location of the URL where an icon is kept. We can also pass icon size. The ipyleaflet will download that image and will use it as a marker.
Once an icon is created then we need to set that icon object as the icon attribute of Marker() constructor.
from ipyleaflet import Icon

m = Map(center=(23,72), zoom=7, basemap = basemaps.Esri.NatGeoWorldMap)

for name, lon, lat in guj_districts_pop[["District", "Longitude", "Latitude"]].values:
    icon = Icon(icon_url='https://image.flaticon.com/icons/png/128/2968/2968342.png', icon_size=[40, 40], icon_anchor=[22,94])
    marker = Marker(location=(lat, lon), icon=icon, title=name, alt=name)
    m.add_layer(marker)

m.layout.height="550px"

m
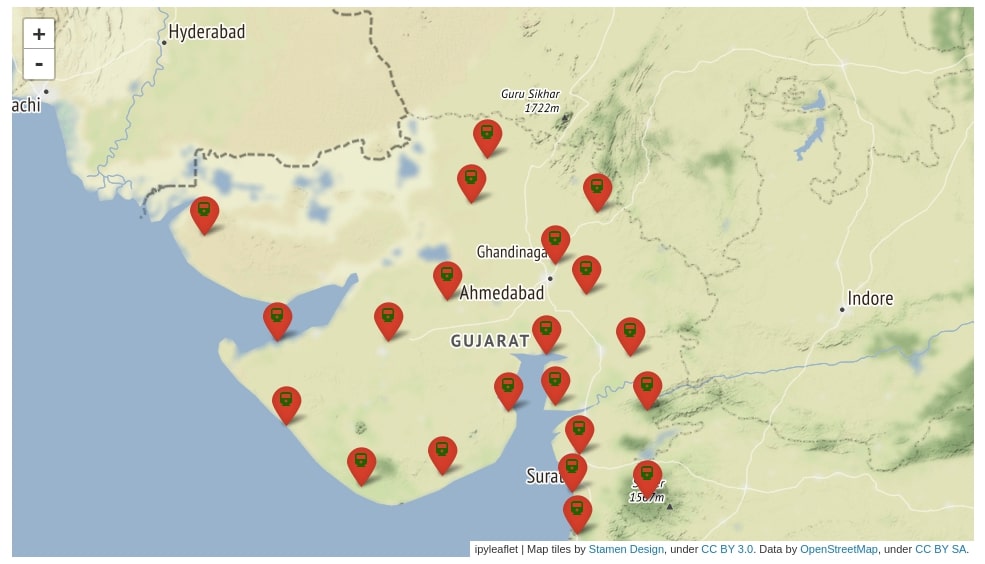
The ipyleaflet also lets us change the image inside of the default image of the marker. We can change the default circle inside of the marker image to other symbols like train, email, help, etc. The ipyleaflet allows us to use any icon available from fontawesome as an icon of the marker.
We need to create an object of AwesomeIcon available from ipyleaflet passing it name of fontawesome that we want to include in our map. We then need to set this icon object as an icon attribute of Marker().
Please feel free to look at this link in order to look at the names of icons available from fontawesome:
from ipyleaflet import AwesomeIcon

m = Map(center=(23,72), zoom=7, basemap = basemaps.Stamen.Terrain)

for name, lon, lat in guj_districts_pop[["District", "Longitude", "Latitude"]].values:
    icon = AwesomeIcon(name='train', marker_color='red', icon_color='darkgreen')
    marker = Marker(location=(lat, lon), icon=icon, title=name, alt=name)
    m.add_layer(marker)

m.layout.height="550px"

m
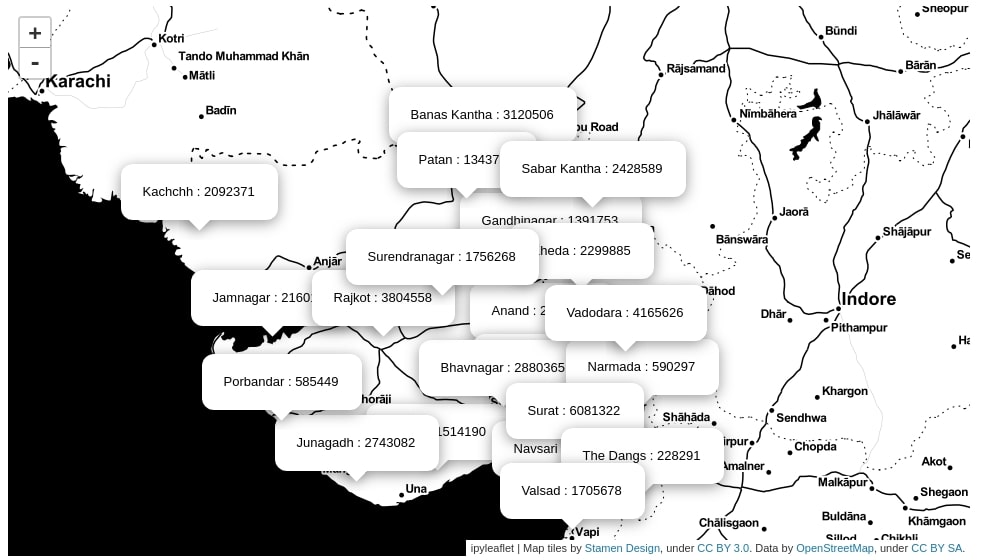
The ipyleaflet also allows us to add a popup to various locations on the map. We can create popup by using the Popup() constructor available from ipyleaflet.
Below we have created popup at various district locations of the state of India. We have also displayed district names and populations in the popup.
The popup object only accepts an object of type ipywidgets.HTML. We first need to create an object of ipywidgets.HTML with string values and then set it as the child attribute of Popup().
from ipyleaflet import Popup
from ipywidgets import HTML

m = Map(center=(23,72), zoom=7, basemap = basemaps.Stamen.Toner)

for name, population, lon, lat in guj_districts_pop[["District", "Population in 2011", "Longitude", "Latitude"]].values:
    message = HTML(value="%s : %d"%(name, population))
    popup = Popup(location=(lat, lon), child=message, close_button=False, auto_close=False, close_on_escape_key=False)
    m.add_layer(popup)

m.layout.height="550px"

m
We can also add a popup on top of markers by creating an object of ipywidgets.HTML and then setting it as the popup attribute of the marker. We have explained the usage of the same in the below example. This popup will appear when someone clicks on a marker.
Please make a note that popup won't be visible on the tutorial page as all maps are shown as a static images. It'll be interactive when code is run in a jupyter notebook.
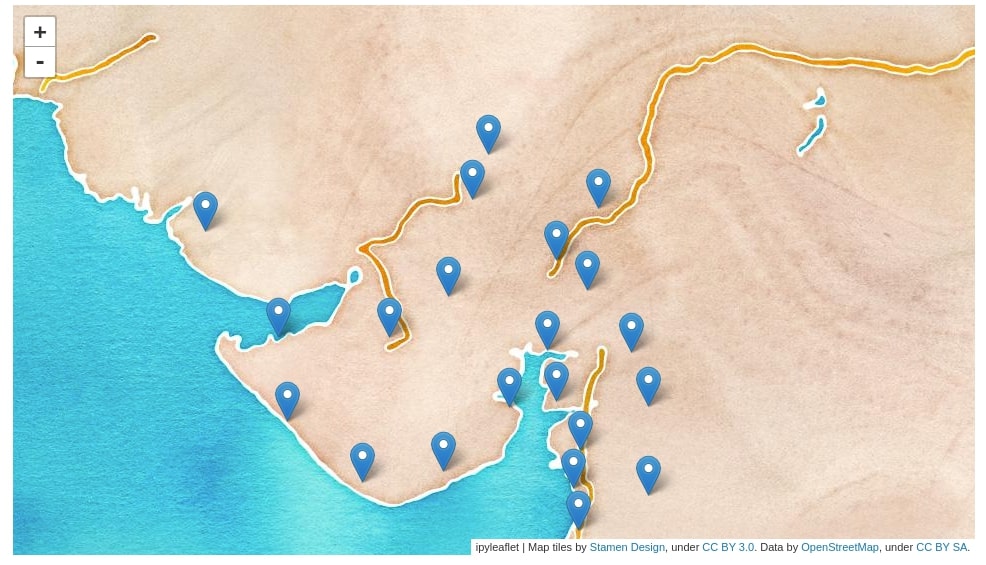
m = Map(center=(23,72), zoom=7, basemap = basemaps.Stamen.Watercolor)

for name, population, lon, lat in guj_districts_pop[["District", "Population in 2011", "Longitude", "Latitude"]].values:
    message = HTML(value="%s : %d"%(name, population))
    marker = Marker(location=(lat, lon))

    marker.popup = message

    m.add_layer(marker)

m.layout.height="550px"

m
Adding Lines, Circles, Rectangles, and Polygons to Map
The ipyleaflet provides various constructors that let us add various shapes like lines, polygons, rectangle, circles, etc on map. We'll now explain how to add various shapes on the map on by one.
Poly Lines
The lines can be added to the ipyleaflet map using the Polyline constructor of ipyleaflet. Below we have drawn a line between the first three districts of the Indian state dataframe.
We need to pass a list of a tuple of latitude and longitude to the locations attribute of Polyline(). We then need to add this polyline object map using the add_layer() method map passing it polyline object. We can also set attributes like the color of the line, the width of the line , etc.
Please make a note that the locations attribute expects location details as python list object and will result in an error if numpy array or any other object type is passed.
from ipyleaflet import Polyline
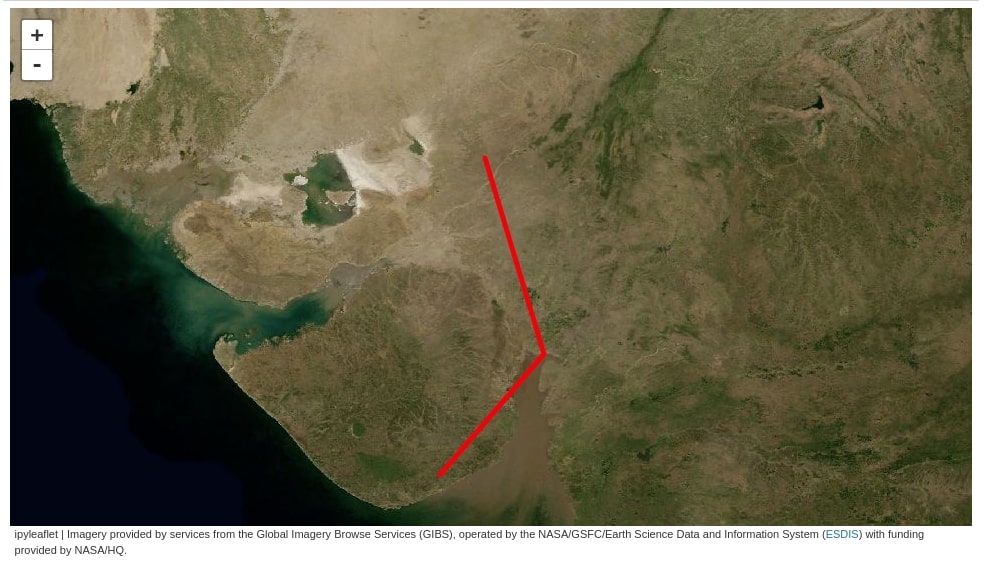
m = Map(center=(23,72), zoom=7, basemap = basemaps.NASAGIBS.BlueMarble)
locations = guj_districts_pop[["Latitude", "Longitude"]][:3].values.tolist()
poly_line = Polyline(locations=locations, color="red" , fill=False)
m.add_layer(poly_line)
m.layout.height="550px"
m
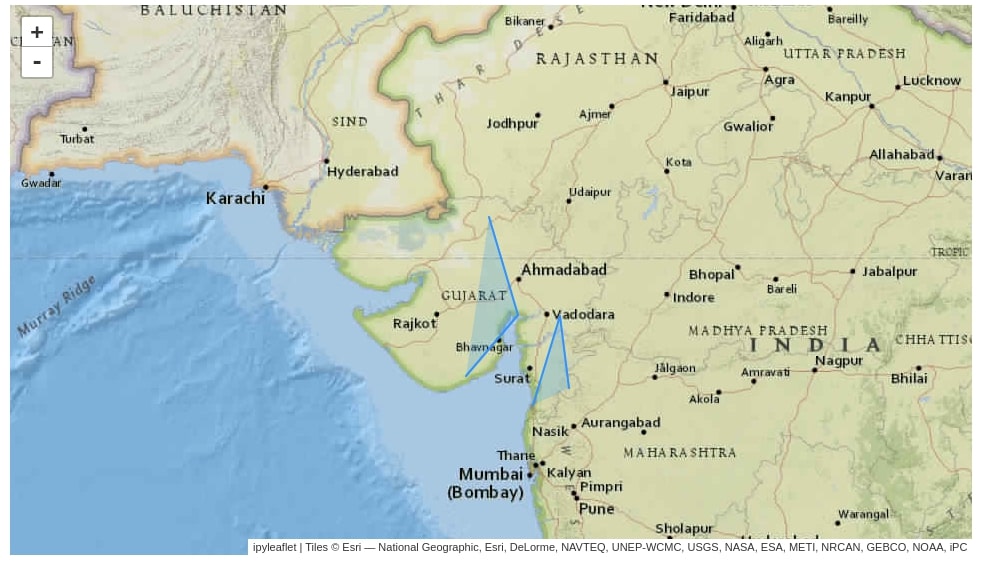
Below we have explained another example to show usage of Polyline(). This time we have added two polylines to the map. One polyline consist of the first three district locations of the state and the second polyline consists of the last three district locations of the state. We have also changed line color and width this time from default. We can also fill the area covered by polyline by setting the fill attribute of the constructor to True. It'll fill the area created by connecting endpoints of the polyline.
m = Map(center=(23,72), zoom=6, basemap = basemaps.Esri.NatGeoWorldMap)

locations1 = guj_districts_pop[["Latitude", "Longitude"]][:3].values.tolist()
locations2 = guj_districts_pop[["Latitude", "Longitude"]][-3:].values.tolist()
poly_line = Polyline(locations=[locations1, locations2], color="dodgerblue" , fill=True, weight=2)

m.add_layer(poly_line)

m.layout.height="550px"

m
Polygons
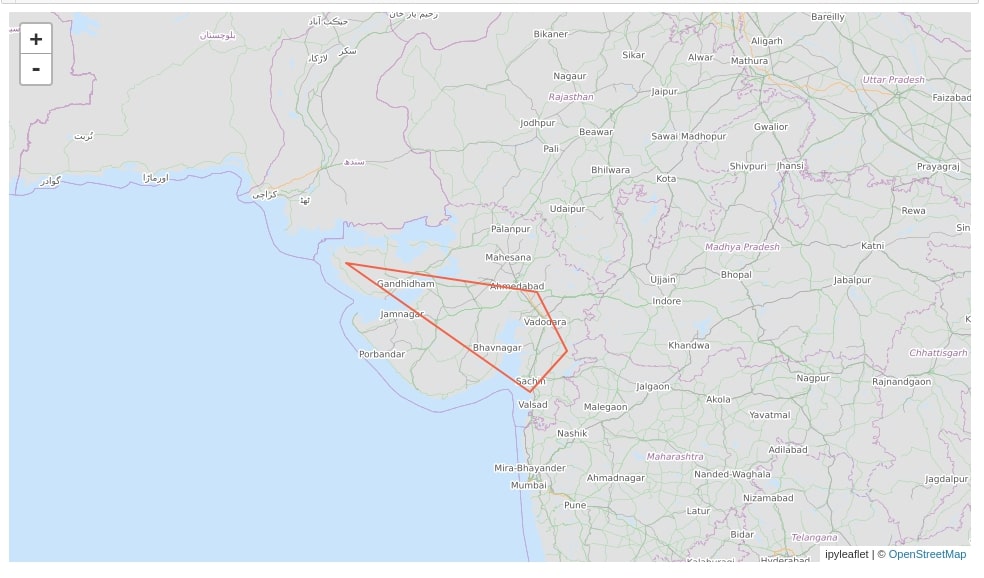
We can create a polygon on ipyleaflet maps by using the Polygon() constructor. The usage of Polygon() constructor is the same as that of Polyline(). It also accepts a list of locations connecting which polygon needs to be created. Below we have created a polygon connecting four district locations.
from ipyleaflet import Polygon

m = Map(center=(23,72), zoom=6, basemap = basemaps.HikeBike.HikeBike)

locations1 = guj_districts_pop[["Latitude", "Longitude"]][8:12].values.tolist()
poly_line = Polygon(locations=locations1, color="tomato" , fill=False, weight=2)

m.add_layer(poly_line)

m.layout.height="550px"

m
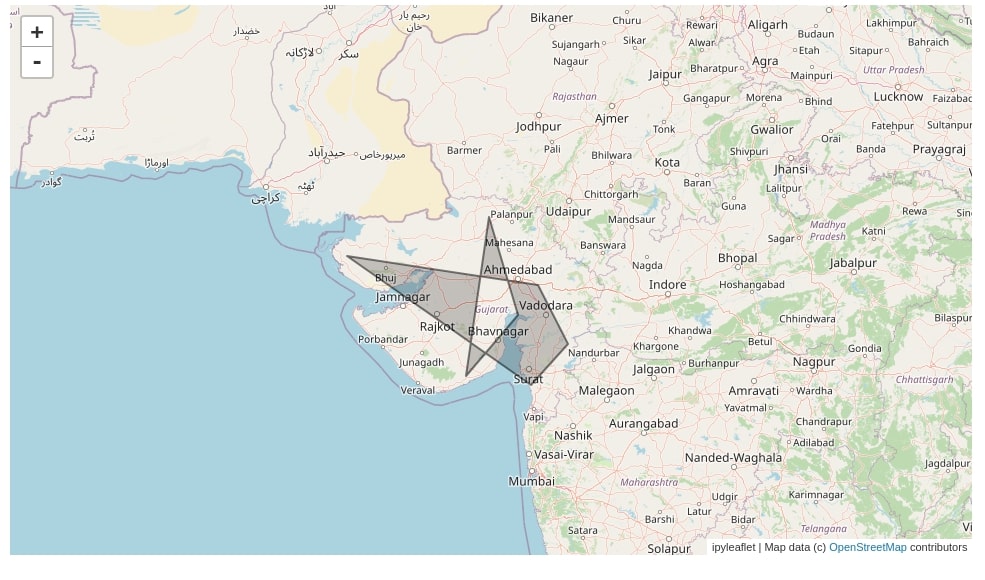
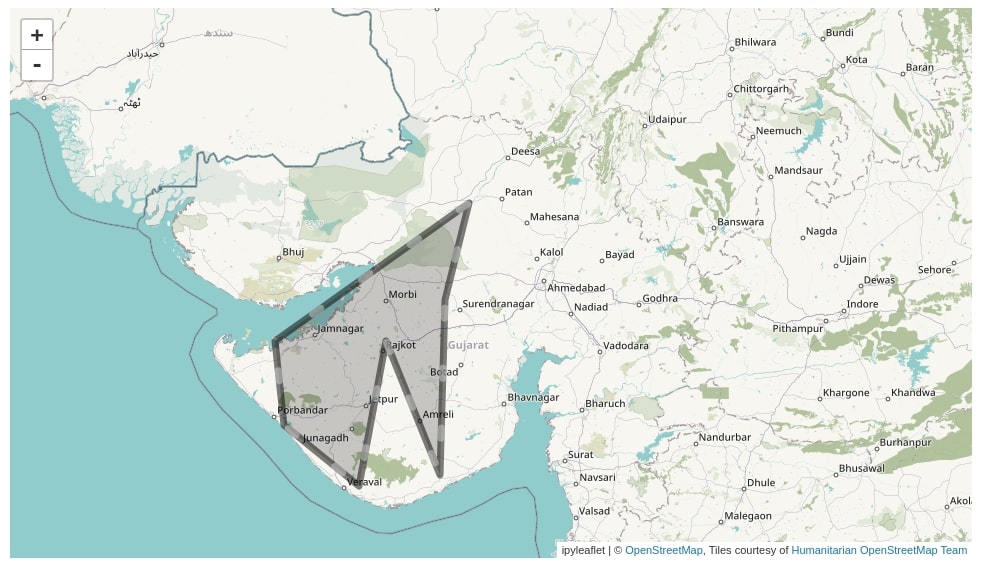
Below is another example demonstrating the usage of Polygon(). This time we have added two polygons to the chart as well as modified a few polygon attributes like color, line width, opacity, etc.
from ipyleaflet import Polygon

m = Map(center=(23,72), zoom=6)

locations1 = guj_districts_pop[["Latitude", "Longitude"]][:3].values.tolist()
locations2 = guj_districts_pop[["Latitude", "Longitude"]][8:12].values.tolist()
poly_line = Polygon(locations=[locations1, locations2], color="black", stroke=True, opacity=0.5, weight=2)

m.add_layer(poly_line)

m.layout.height="550px"

m
Rectangle
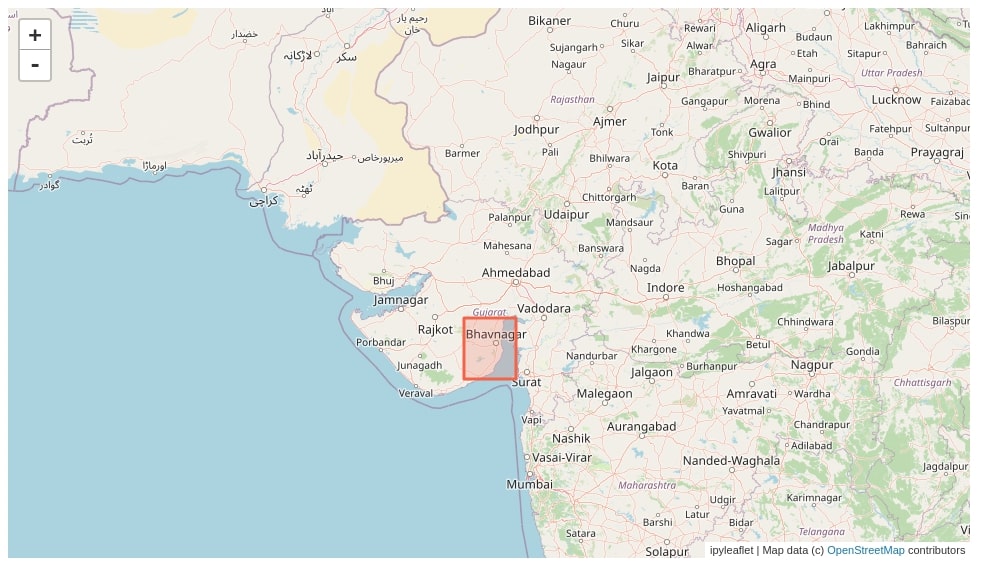
We can easily add a rectangle to the ipyleaflet map by using the Rectangle() constructor. We need to pass a list of two tuples with latitude and longitude details to the Rectangle() constructor as bounds and it'll create a rectangle connecting those locations. We can modify the rectangle line color, width, fill, etc as well.
from ipyleaflet import Rectangle

m = Map(center=(23,72), zoom=6)

rect_locs = guj_districts_pop[["Latitude", "Longitude"]][:2].values.tolist()
rectangle = Rectangle(bounds=rect_locs, color="tomato", weight=3)

m.add_layer(rectangle)

m.layout.height="550px"

m
Circles
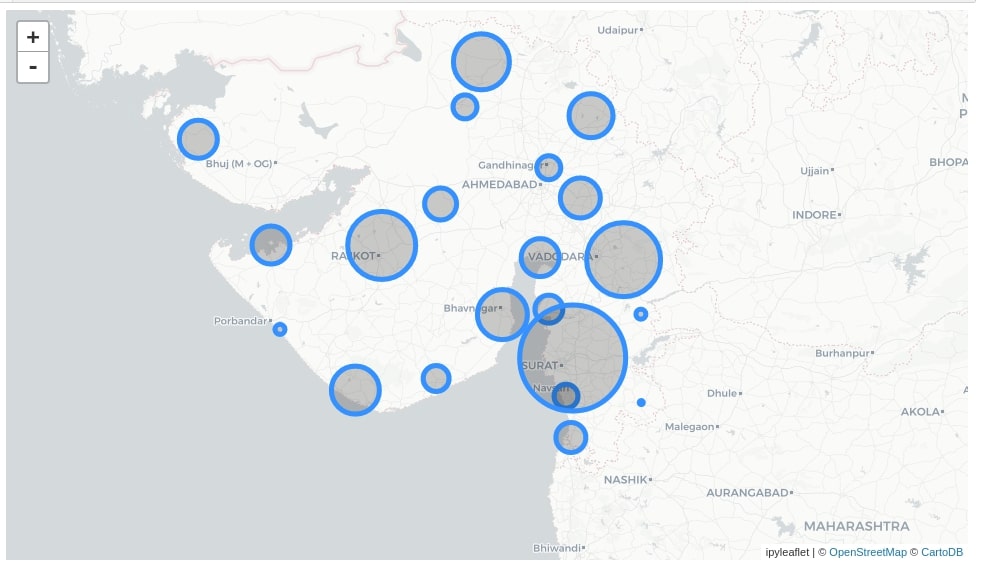
The ipyleaflet lets us add a circle of different sizes on maps as well. We can create a circle by calling Circle() constructor passing it a location where the circle needs to be created. We can also modify circle size by setting the radius attribute of Circle().
Below we have created a circle at each district location of the Indian state. We have also modified the size of a circle based on the population of that district. We have also added popup displaying district name and population when someone clicks on the circle.
from ipyleaflet import Circle

m = Map(center=(22,72), zoom=7, basemap = basemaps.CartoDB.Positron)

for name, population, lon, lat in guj_districts_pop[["District", "Population in 2011", "Longitude", "Latitude"]].values:
    message = HTML(value="%s : %d"%(name, population))
    circle = Circle(location=(lat, lon), radius=population//100, color="dodgerblue", fill_color="black")

    circle.popup = message

    m.add_layer(circle)

m.layout.height="550px"

m
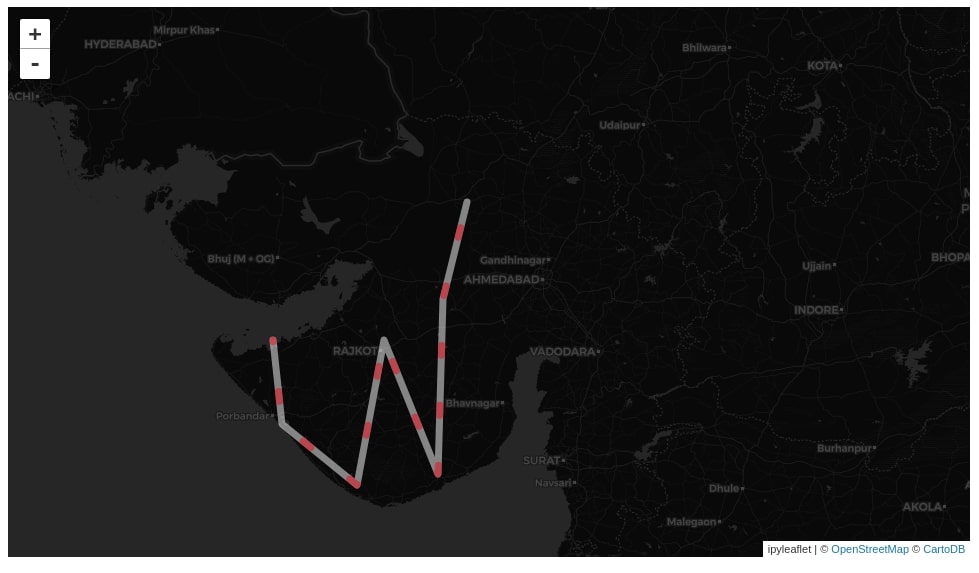
Ant Path
The ipyleaflet provides us unique functionality which lets us create a line between locations of map-like an ant is moving. It can be very useful to show the movement of any kind of resource from one location to another. Its commonly referred to as the ant path and can be created using the AntPath() constructor.
We need to pass it a list of locations as a tuple of latitude and longitude. It'll then create an ant path between that location with a path starting from the first location. We can also change the path of ants movement from the last point to the first by setting the reverse attribute to True.
Please make a note that the ant movement will not be visible on the tutorial page but it'll be visible when code is run in the jupyter notebook.
from ipyleaflet import AntPath

m = Map(center=(23,72), zoom=7, basemap = basemaps.CartoDB.DarkMatter)

locations = guj_districts_pop.sort_values(by=["Longitude"])[["Latitude", "Longitude"]][1:8].values.tolist()
ant_path = AntPath(locations = locations, weight=7, delay=500, color="white", pulse_color="red", dash_array=[10,50])

m.add_layer(ant_path)

m.layout.height="550px"

m
Below we have created another example of usage of AntPath() where we have created polygon of movement. We have also modified various attributes like path width, color, movement speed, etc.
m = Map(center=(23,72), zoom=7, basemap = basemaps.OpenStreetMap.HOT)

locations = guj_districts_pop.sort_values(by=["Longitude"])[["Latitude", "Longitude"]][1:8].values.tolist()
ant_path = AntPath(locations = locations,
                   weight=7,
                   delay=500, color="black", pulse_color="lightgray",
                   dash_array=[10,50], use="polygon")

m.add_layer(ant_path)

m.layout.height="550px"

m
Starbucks Store Locations Interactive Scatter Plot
We'll now explain another example where we'll plot CircleMarker() on a chart depicting different locations of new york where there is a Starbucks store. We'll be using the Starbucks store locations dataset available from kaggle for this.
Please feel free to download the dataset to follow along.
starbucks = pd.read_csv("datasets/starbucks_store_locations.csv")
starbucks.head()
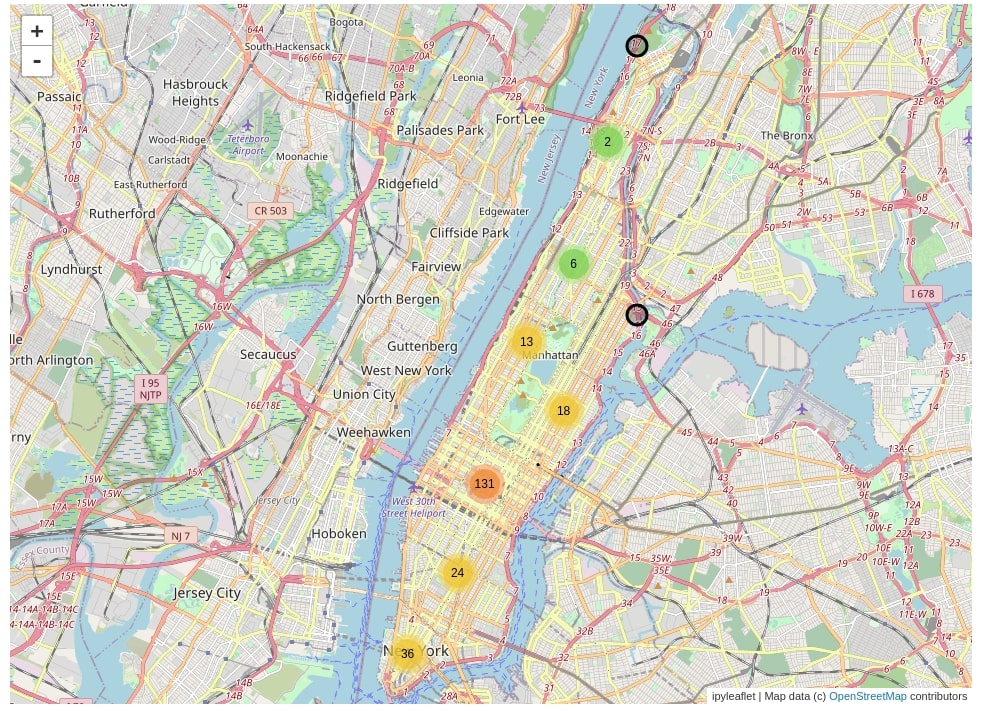
Below we have created a circle on all locations in new york where there is a Starbucks store. We have created the MarkerCluster() of all circles in order to prevent the map from getting crowded. We can see the MarkerCluster() has created clusters of circles where the stores are very near to each other. We can click on that cluster and it'll zoom and expand circles. We have also used popup which will display the store name and country when clicked on the circle.
from ipyleaflet import CircleMarker

m = Map(zoom=12, center=(40.79,-73.98))

markers = []
for name, country, lon, lat in starbucks[(starbucks.Country=="US") & (starbucks.City=="New York")][["Store Name", "Country", "Longitude", "Latitude"]].values:
    message = HTML(value="%s : %s"%(name, country))
    circle = CircleMarker(location=(lat, lon), color="black", fill_color="black", weight=3)

    circle.popup = message

    markers.append(circle)

marker_cluster = MarkerCluster(markers=markers)
m.add_layer(marker_cluster)

m.layout.height="700px"

m
This ends our small tutorials explained the API of ipyleaflet to create maps. Please feel free to let us know your views in the comments section.
References
- Folium - Interactive Maps in Python Jupyter Notebook
- ipywidgets - Interactive Widgets in Jupyter Notebook
- traitlets - Eventful Classes in Python
- hvplot - How to convert static geopandas maps to interactive
- geopandas - Plotting Static Maps in Python
- Cartopy - Static Maps in Python
- Plotting Maps using Bokeh
- Interactive Choropleth Maps using bqplot
- Choropleth Maps using ipyleaflet
- Choropleth Maps and Scatter Maps using Cufflinks
- Connection Map in Python using Plotly and Geopandas
 Sunny Solanki
Sunny Solanki
Intro: Software Developer | Youtuber | Bonsai Enthusiast
About: Sunny Solanki holds a bachelor's degree in Information Technology (2006-2010) from L.D. College of Engineering. Post completion of his graduation, he has 8.5+ years of experience (2011-2019) in the IT Industry (TCS). His IT experience involves working on Python & Java Projects with US/Canada banking clients. Since 2020, he’s primarily concentrating on growing CoderzColumn.
His main areas of interest are AI, Machine Learning, Data Visualization, and Concurrent Programming. He has good hands-on with Python and its ecosystem libraries.
Apart from his tech life, he prefers reading biographies and autobiographies. And yes, he spends his leisure time taking care of his plants and a few pre-Bonsai trees.
Contact: sunny.2309@yahoo.in


![YouTube Subscribe]() Comfortable Learning through Video Tutorials?
Comfortable Learning through Video Tutorials?
If you are more comfortable learning through video tutorials then we would recommend that you subscribe to our YouTube channel.
![Need Help]() Stuck Somewhere? Need Help with Coding? Have Doubts About the Topic/Code?
Stuck Somewhere? Need Help with Coding? Have Doubts About the Topic/Code?
 Stuck Somewhere? Need Help with Coding? Have Doubts About the Topic/Code?
When going through coding examples, it's quite common to have doubts and errors.
If you have doubts about some code examples or are stuck somewhere when trying our code, send us an email at coderzcolumn07@gmail.com. We'll help you or point you in the direction where you can find a solution to your problem.
You can even send us a mail if you are trying something new and need guidance regarding coding. We'll try to respond as soon as possible.
![Share Views]() Want to Share Your Views? Have Any Suggestions?
Want to Share Your Views? Have Any Suggestions?
 Want to Share Your Views? Have Any Suggestions?
If you want to
- provide some suggestions on topic
- share your views
- include some details in tutorial
- suggest some new topics on which we should create tutorials/blogs
 ipyleaflet, maps