Sweetviz: Automate Exploratory Data Analysis (EDA)
Exploratory data analysis (EDA) is the process of analyzing datasets using different visualizations and basic summary statics to understand the various relationships, distributions, etc of data variables. It is generally the first step performed with new datasets to get insights about data. Doing EDA manually, where we create various visualizations and statistics by our selves can sometimes result in mistakes. It can also take a lot of time. The time which can be otherwise utilized in performing other more important tasks.
Sweetviz is a wonderful and very useful Python library that provides us with the EDA of a given dataset with just 2 lines of code. It generates an independent HTML page report with interactive visualizations of a dataset. It can save a lot of our time which would have otherwise been spent doing EDA manually. It also saves us from mistakes which we could introduce when doing things by ourselves.
Functionalities Provided by Sweetviz
Sweetviz let us perform a list of different analyses as mentioned below.
- Single Dataset Analysis - It shows summary statistics (min, max, median, quantiles, etc.) about each data column, visualizations showing the distribution of it (histograms, quantile charts, etc), missing counts, correlation with other data columns, etc.
- Target Variable Analysis - It includes all details mentioned in single dataset analysis along with the relationship of each data column with the target variable (column that we want to predict in ML). It highlights the target variable column separately in the application as well.
- Compare two datasets (train vs validation, train vs test, test vs validation, etc) - It provides summary statistics, visualizations of relations, correlation, etc details for two datasets next to each other. It can help us understand how different data columns are distributed in two different datasets.
- Divide Dataset using boolean variable and Compare them - This analysis works like comparing two datasets only but for this we don't give two different datasets, instead we give series/list of boolean values and comparison will happen between datasets generated dividing original dataset based on this True/False boolean values. The series/list of boolean values should be of the same length as our original dataset. The boolean values are given generally from our original dataset which has boolean columns like gender column (male vs female), etc.
We'll now start explaining how to use sweetviz with examples.
Important Sections of Tutorial
We have imported the necessary libraries for our purpose. We'll be using various datasets available from scikit-learn for explanation purposes.
import pandas as pd

import sweetviz

print("SweetViz Version : {}".format(sweetviz.__version__))
Load Datasets 
Below we have loaded 3 datasets available from scikit-learn which we'll be using in our examples. We have loaded each dataset as a pandas dataframe and displayed the first few lines for each to give an idea about the contents of the datasets.
- Wine Dataset - This is a classification dataset that has information about ingredients (alcohol, malic acid, magnesium, ash, etc) used in 3 different types of wines.
- Diabetes Dataset - This is a regression dataset that has information about ten baseline variables based on which measure of disease progression will happen after 1 year. The quantitative measure of disease progression after 1 year is the target variable.
- Boston Dataset - This dataset has information about a number of attributes related to housing in the Boston area. The target variable is a median value of a home in 1000's dollars.
from sklearn import datasets
from sklearn.model_selection import train_test_split
wine = datasets.load_wine()

wine_df = pd.DataFrame(data=wine.data, columns=wine.feature_names)

#wine_df["WineType"] = [wine.target_names[typ] for typ in wine.target]
wine_df["WineType"] = wine.target

wine_df.head()
diabetes = datasets.load_diabetes()

diabetes_df = pd.DataFrame(data=diabetes.data, columns=diabetes.feature_names)

diabetes_df["Progression"] = diabetes.target

diabetes_df.head()
boston = datasets.load_boston()

boston_df = pd.DataFrame(data=boston.data, columns=boston.feature_names)

boston_df["Price"] = boston.target

boston_df.head()
EDA Using Sweetviz 
As a part of this section, we'll explain how to perform EDA using the datasets loaded above. Sweetviz provides 3 different methods primarily for performing exploratory data analysis. We have given definitions of each so that it becomes easy to use them.
- analyze(source=None,target_feat=None,feat_cf=None,pairwise_analysis='auto') - This method let us perform EDA on a single dataset given as first parameter (source).
- The source parameter takes as input pandas dataframe or tuple of dataframe and dataset name. The name given as input will be used in visualization.
- The target_feat parameter takes as input string which is the target variable. We want to see a relation between all other data columns and the target variable. This parameter is optional.
- The feat_cfg parameter takes as input instance of FeatureConfig. The FeatureConfig lets us declare which data columns should be used as numeric, which should be used as categorical and which should be used as text. This lets us explicitly specify data column types if we want to override default settings.
- The pairwise_analysis takes as input one of the three input strings ('auto', 'on' and 'off'). It'll show a correlation between different columns based on this parameter. The default is 'auto' which will show correlation whenever possible. If we set the value as 'off' then it won't show a relationship.
- compare(source=None,compare=None,target_feat=None,feat_cfg=None,pairwise_analysis=None) - This method takes two dataset as input and let us perform EDA on both at the same time. It shows EDA for each dataset next to each other for better comparison. This method can be useful for performing EDA on a combination of train/test, train/validation, and test/validation datasets.
- The source and compare parameter takes as input dataframe or tuple of dataframe and dataframe name. The dataframe names provided will be used in visualizations.
- All other parameters work exactly as they work in analyze() method.
- compare_intra(source_df=None,condition_series=None,names=(),target_feat=None,feat_cfg=None,pairwise_analysis=None) - This method takes as input dataset and one boolean series of same length as dataset. It'll then divide the dataset based on boolean values of the series and perform EDA on two datasets generated this way. It generates EDA for both datasets next to each other so we can make a comparison based on it. The series is generally one of the boolean column of a dataset based on which we want to perform EDA.
- The source_df dataset takes as input pandas dataframe.
- The condition_series parameter takes as input boolean series based on which dataset will be divided into two datasets and comparison will happen between them.
- All other parameters work exactly like they do in analyze() and compare() methods.
Please make a NOTE that each of the above-mentioned methods returns an instance of DataframeReport. This instance has two important methods which let us show interactive EDA reports either as an independent HTML application or inside of a jupyter notebook.
Each of the above-mentioned methods will show a progress bar when it's generating EDA.
Important Methods of DataFrameReport Object
- show_html(filepath='SWEETVIZ_REPORT.html',open_browser=True,layout='widescreen',scale=None) - This method will open report in browser as separate application. We can then interact with it and look at EDA results.
- show_notebook(w=None,h=None,scale=None,layout=None,filepath=None) - This method will open EDA results report inside of jupyter notebook. It let us provide width and height using parameters.
1. Single Dataset Analysis 
Below we have generated an EDA report for the wine dataset using analyze() method. It returns an instance of type DataframeReport. We can then use it to display reports.
report = sweetviz.analyze(wine_df)
report
Below we have called report_html() method on DataframeReport object. It'll open an HTML report in a browser.
report.show_html()
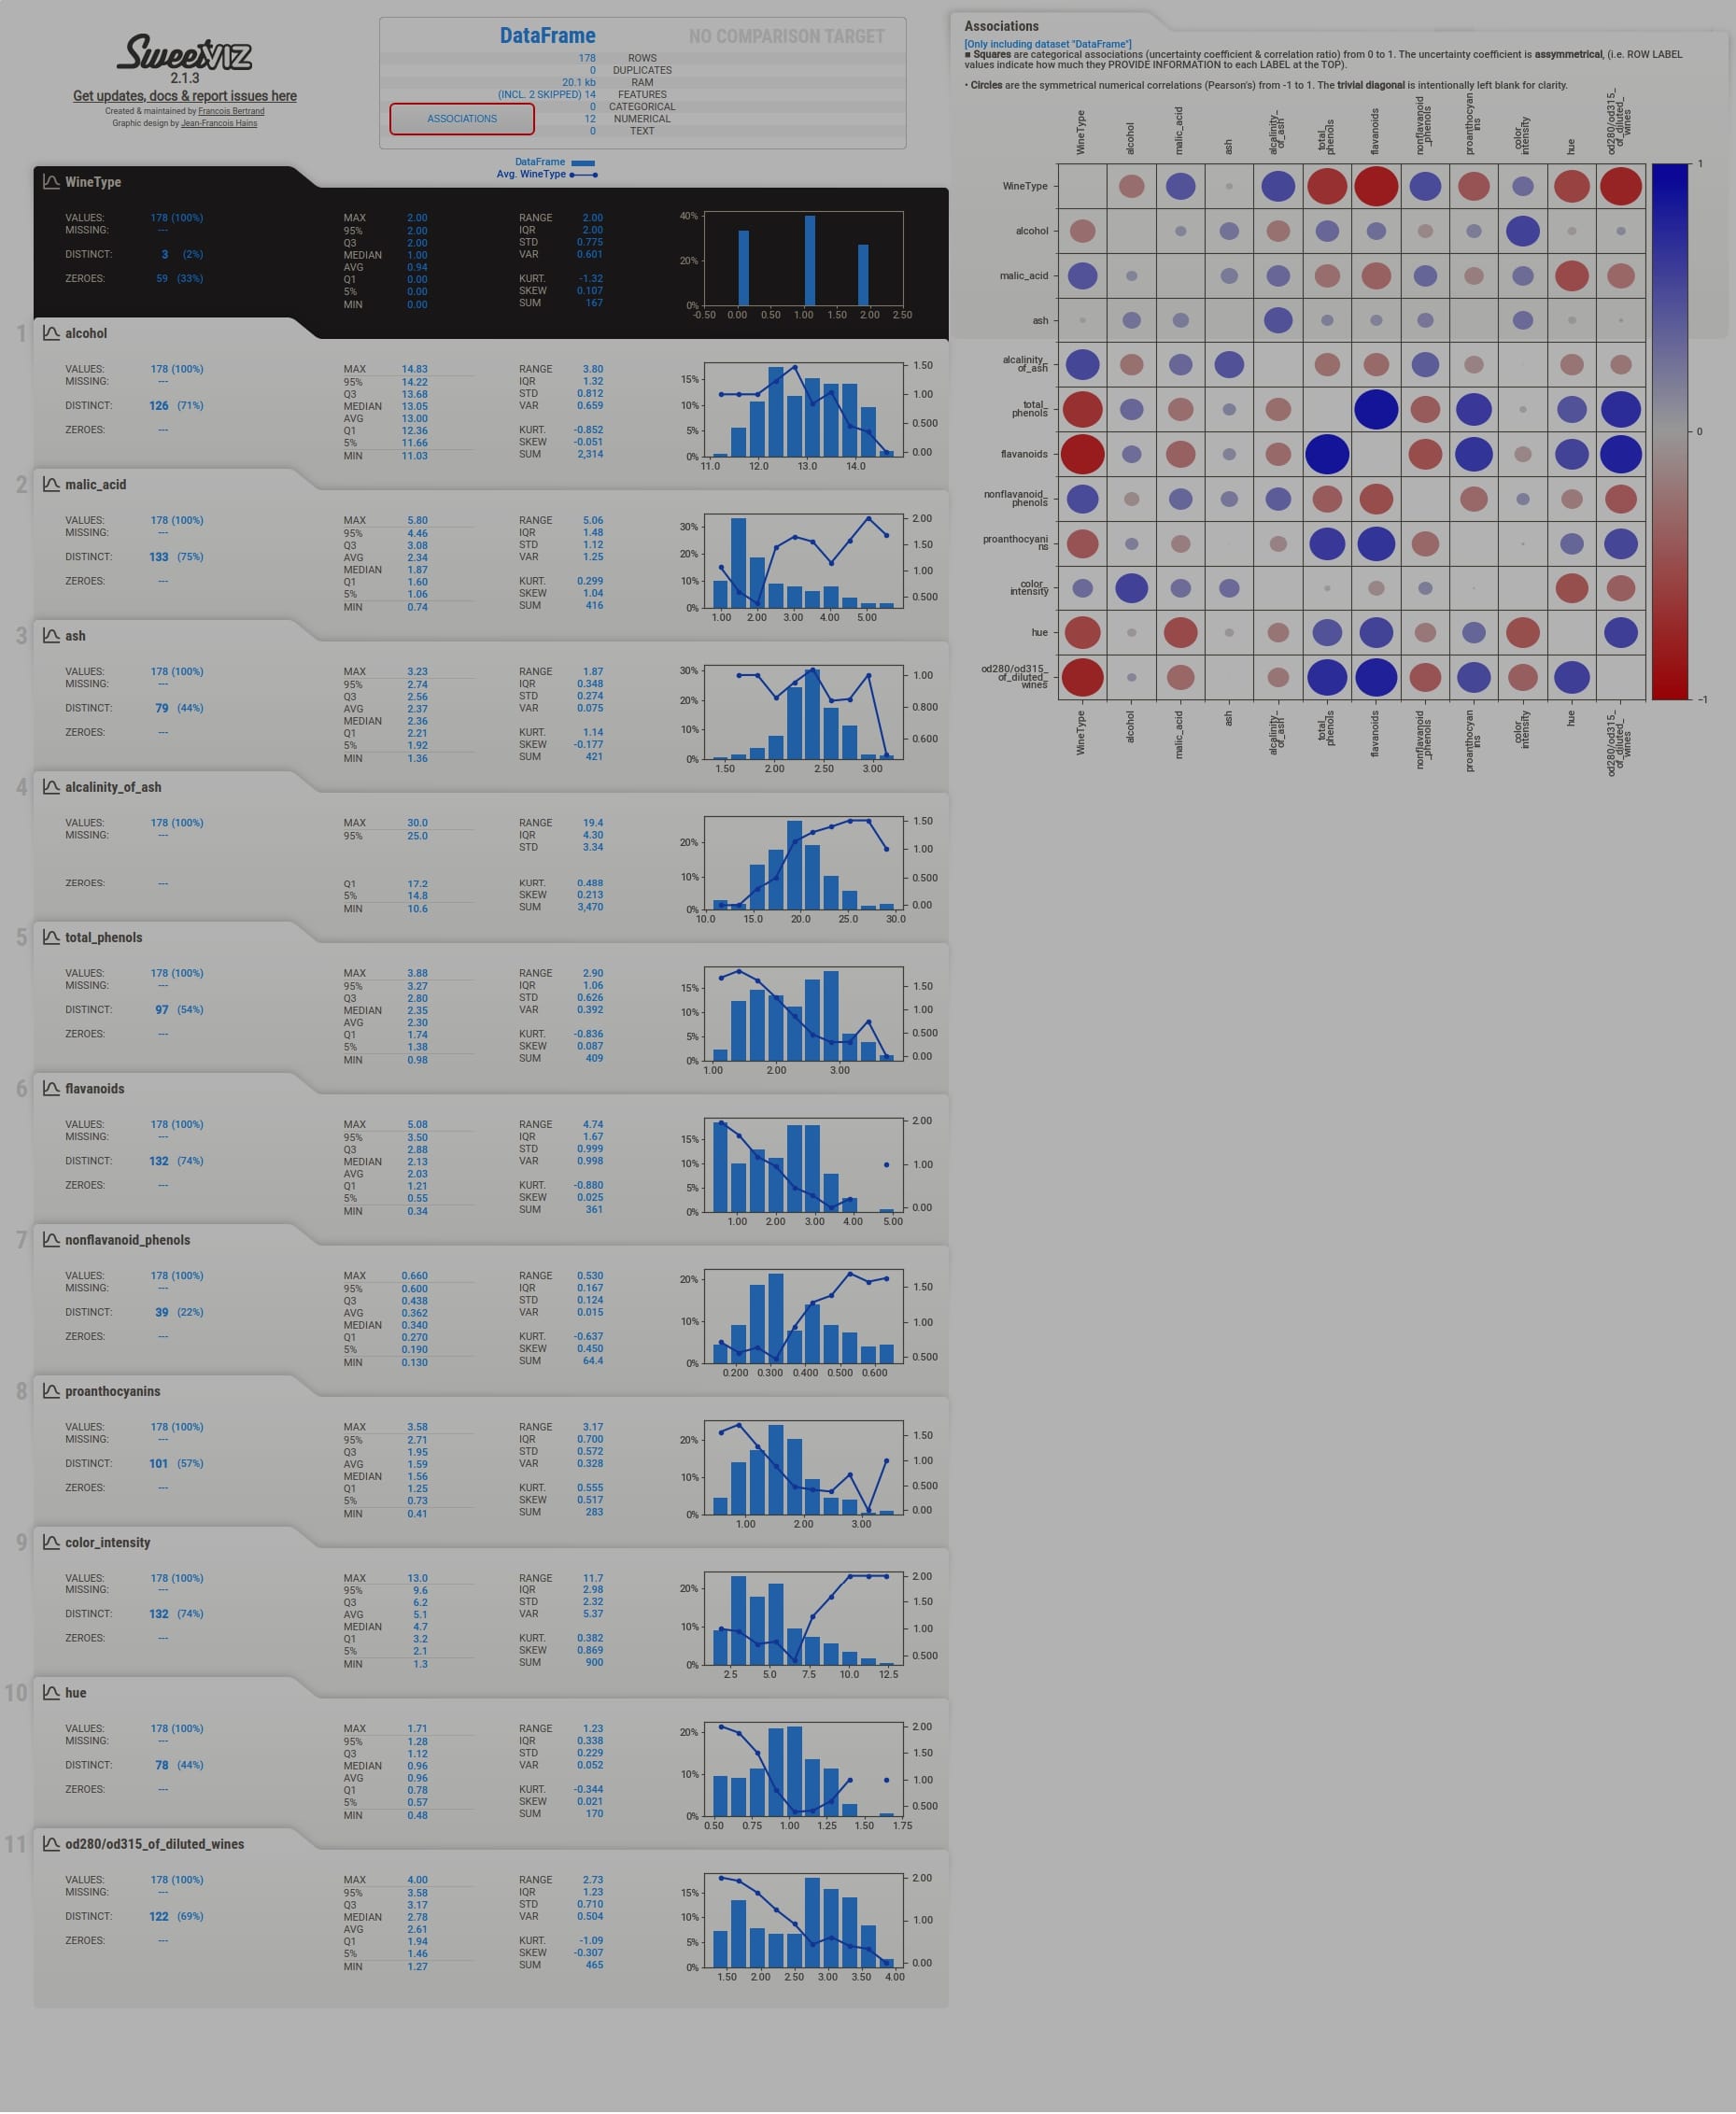
We'll now explain individual parts of the report. The dashboard generated by all three methods (analyze(), compare(), and compare_intra()) will be the same with few more details present based on the method called.
Summary
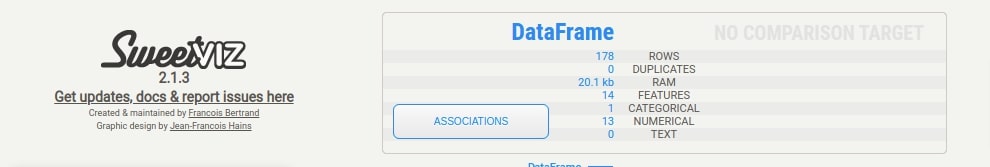
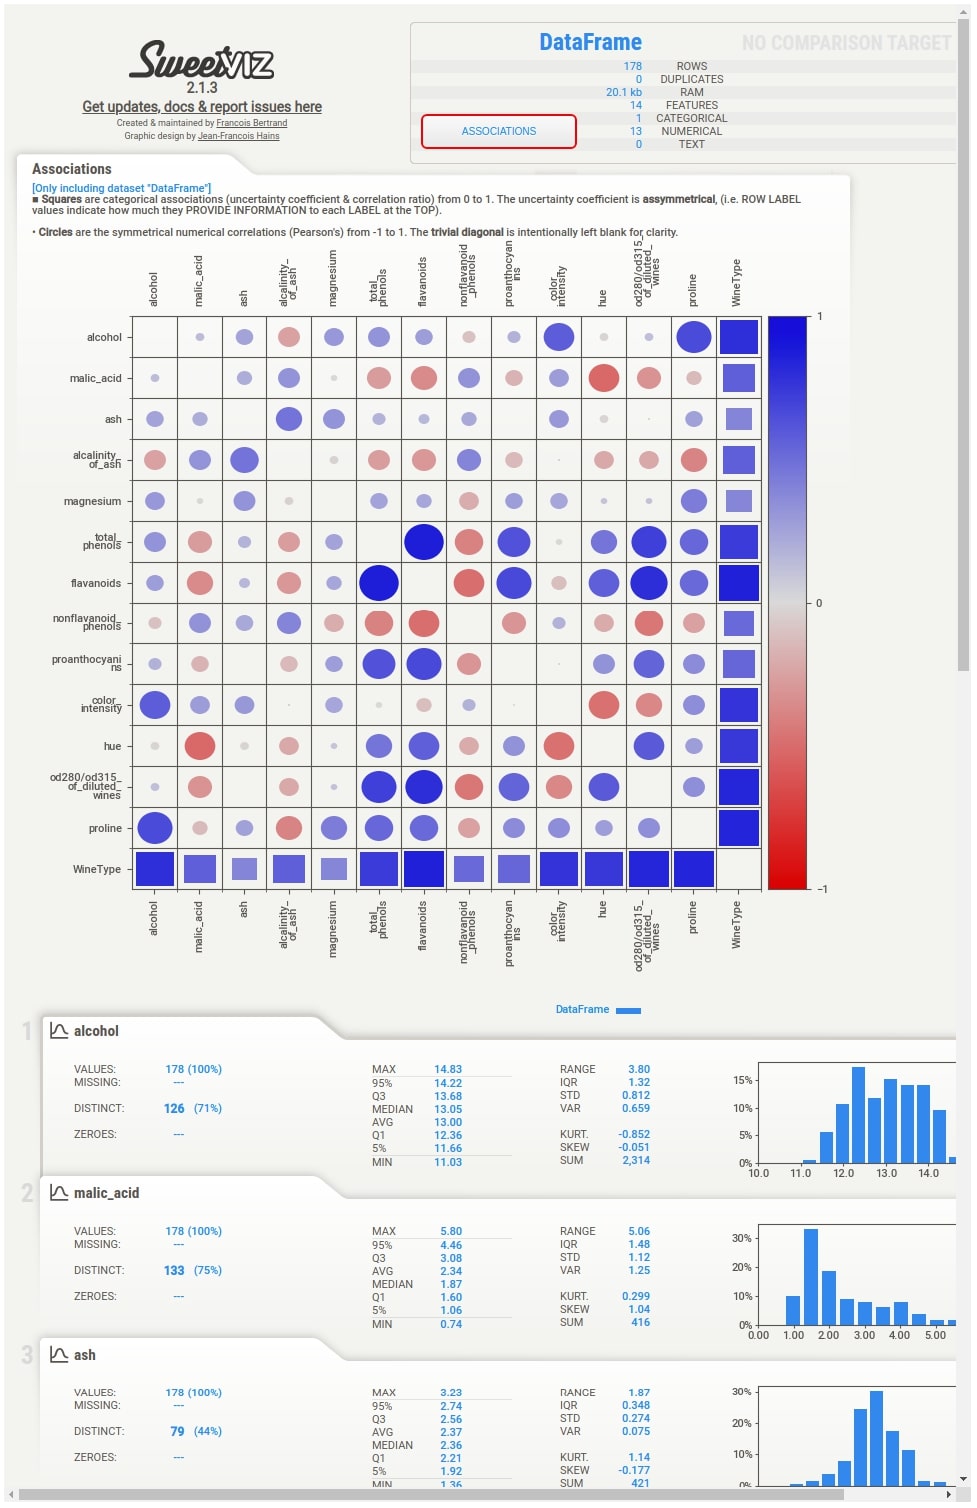
The summary section gives summary stats about the dataset like the number of samples, a number of features, duplicates, RAM usage, categorical features count, numerical features count, and text feature count. It'll show count for two datasets if we have called compare() or compare_intra() methods. In this case, it'll show summary stats about our whole wine dataset. We are also provided with a button named Associations in this section. If we click on that button, it'll generate a correlation heatmap showing the correlation between all features of the dataset (Only numeric features).
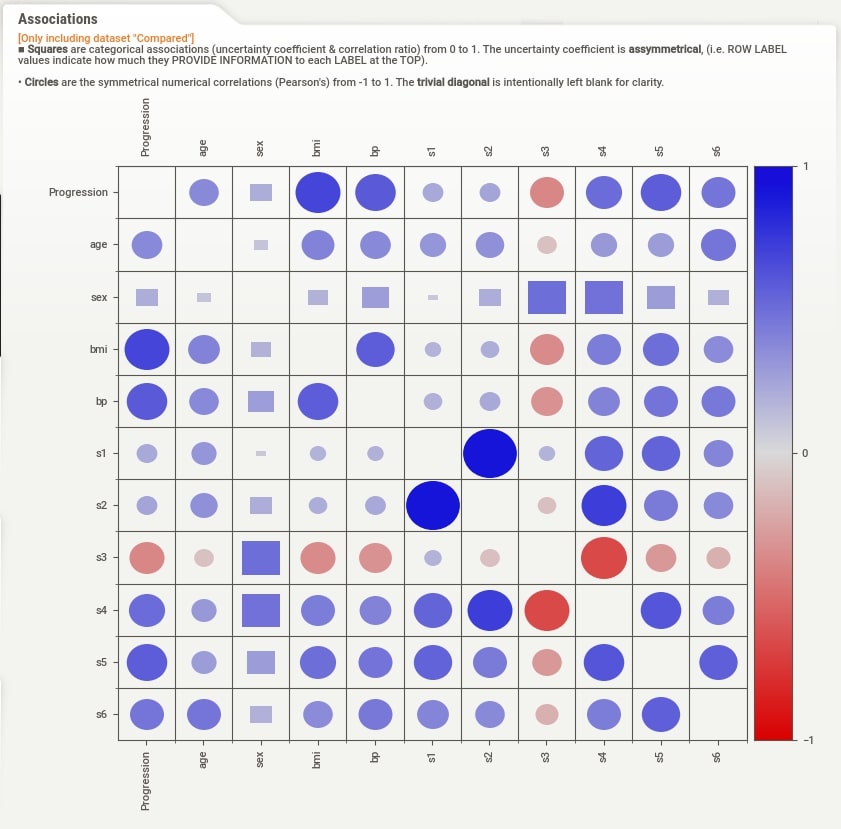
Associations
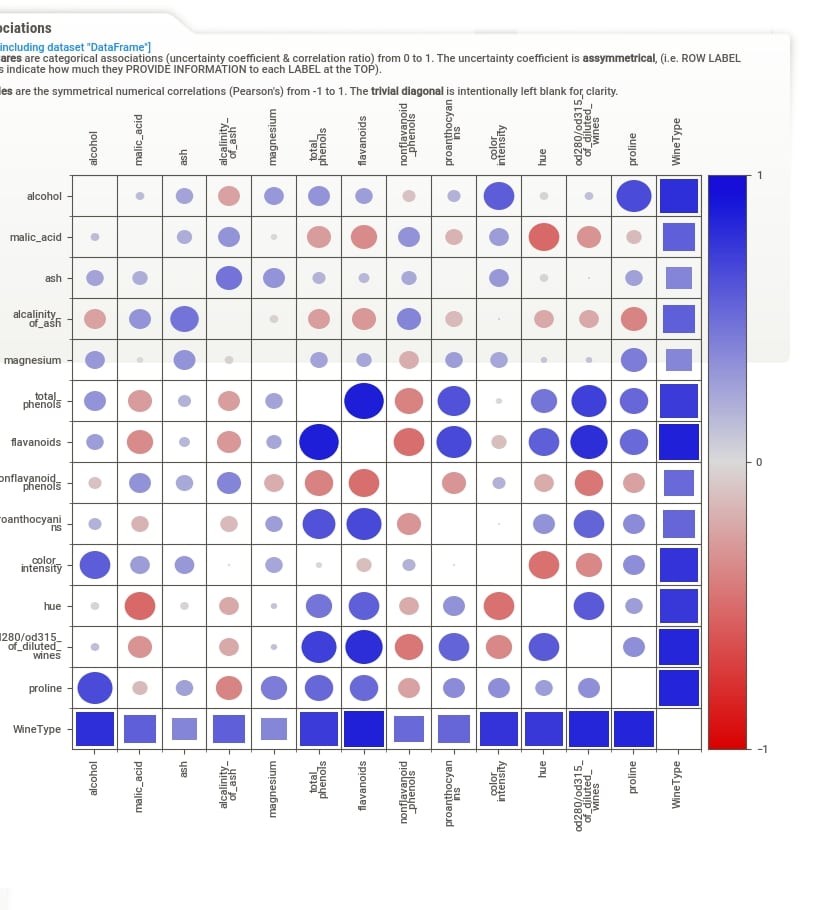
When we click on Associations button from the summary section, the correlation heatmap will appear on the right-hand side of the screen. The heatmap has either squares or circles present in each tile. The circles represent Pearson correlation in the range [-1, 1]. The squares represent categorical associations. The categorical associations go row-wise and show how much association a feature represented by row name on left has with all other features of data. The categorical associations range from [0,1]. The heatmap will have a circle whenever showing the relation between numerical features and squares when showing the relation between categorical features or numerical and categorical features. The diagonal of the chart is left blank as each feature has a total relationship with itself. In our example, the WineType feature is categorical hence row and column representing WineType has squares whereas all other cells have circles because all other features are numerical.
Individual Column Stats
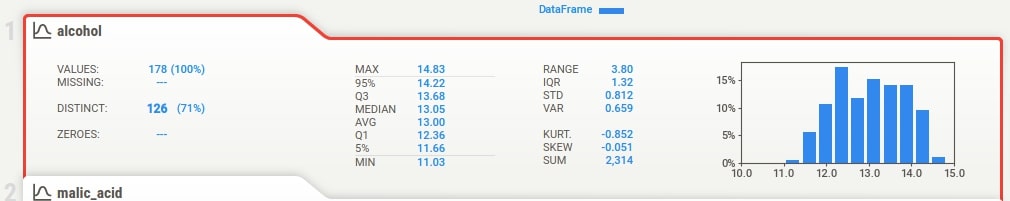
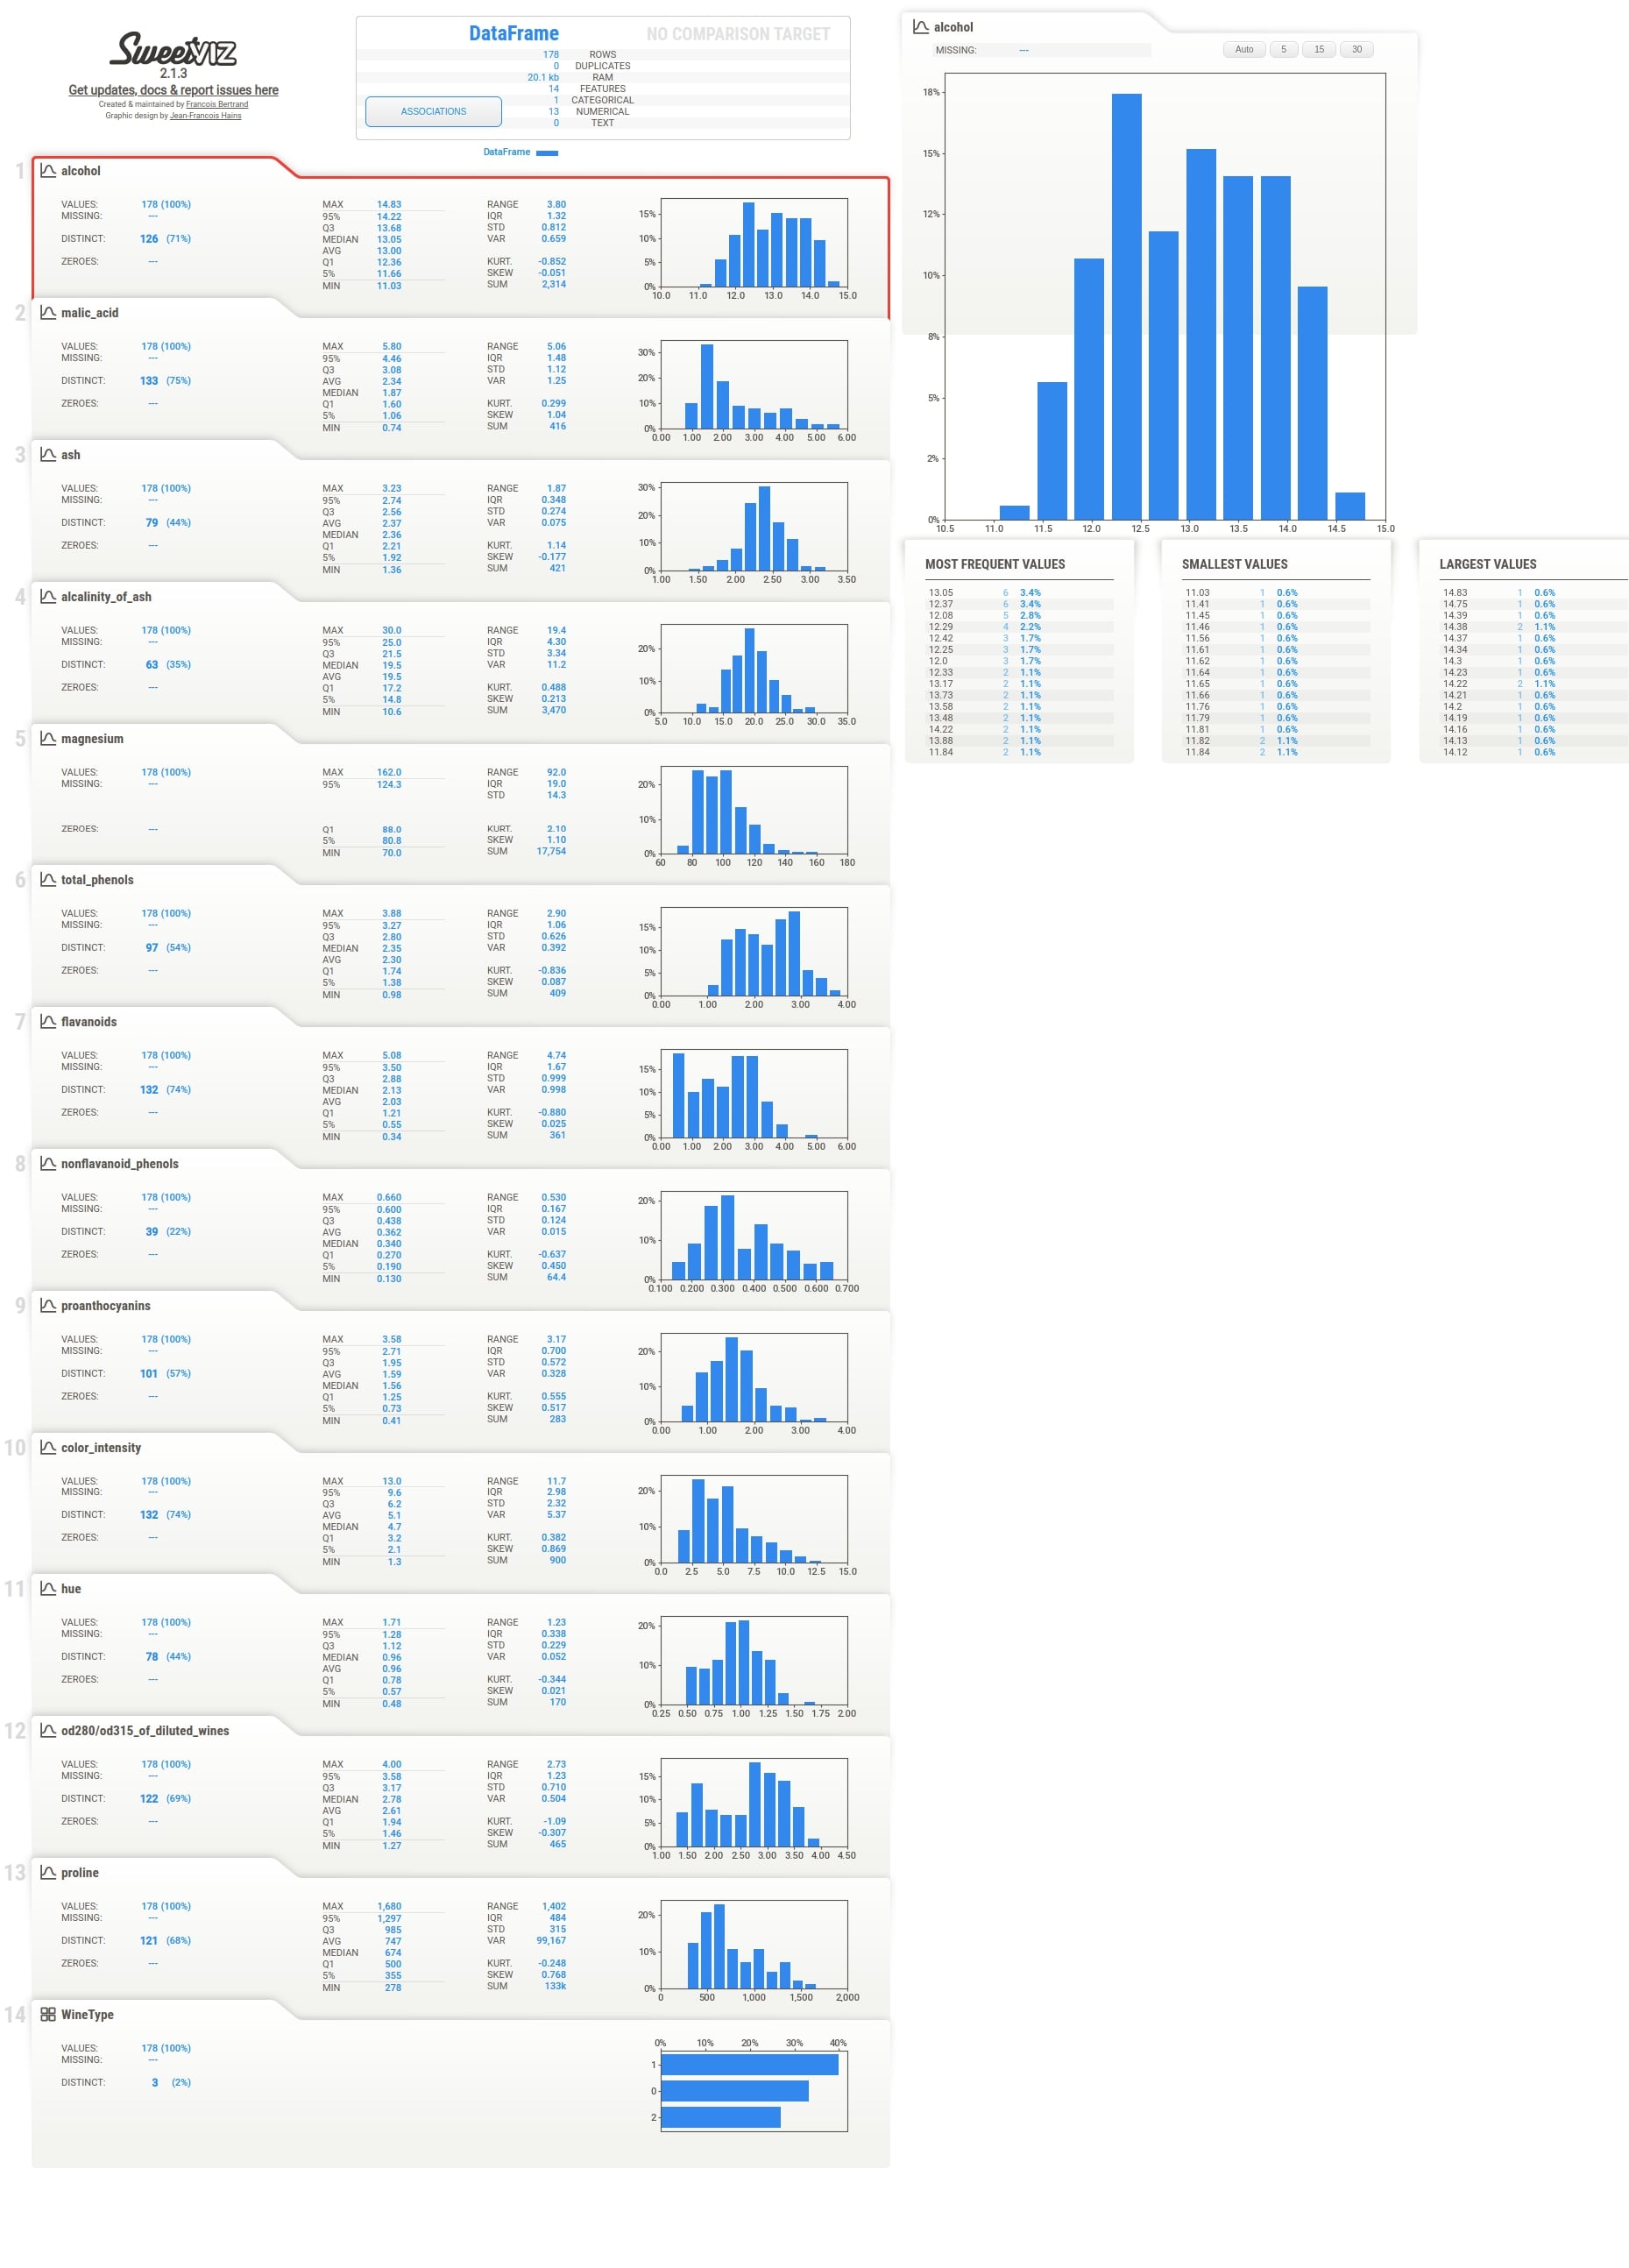
Below the summary section, there is a tab for each feature of our dataset. It has also a tab for the target variable if we have provided a column name to be treated as the target variable. The tab has basic stats about the feature like total values, missing count, min, max, median, average, quantiles, range, standard deviation, etc. It also has a histogram showing the distribution of feature data. We can click on the tab and it'll open one more tab on the right-hand side showing more details about the feature. If we have provided a target variable name then the tab for it'll be present first and it'll be colored black to differentiate it from other columns.
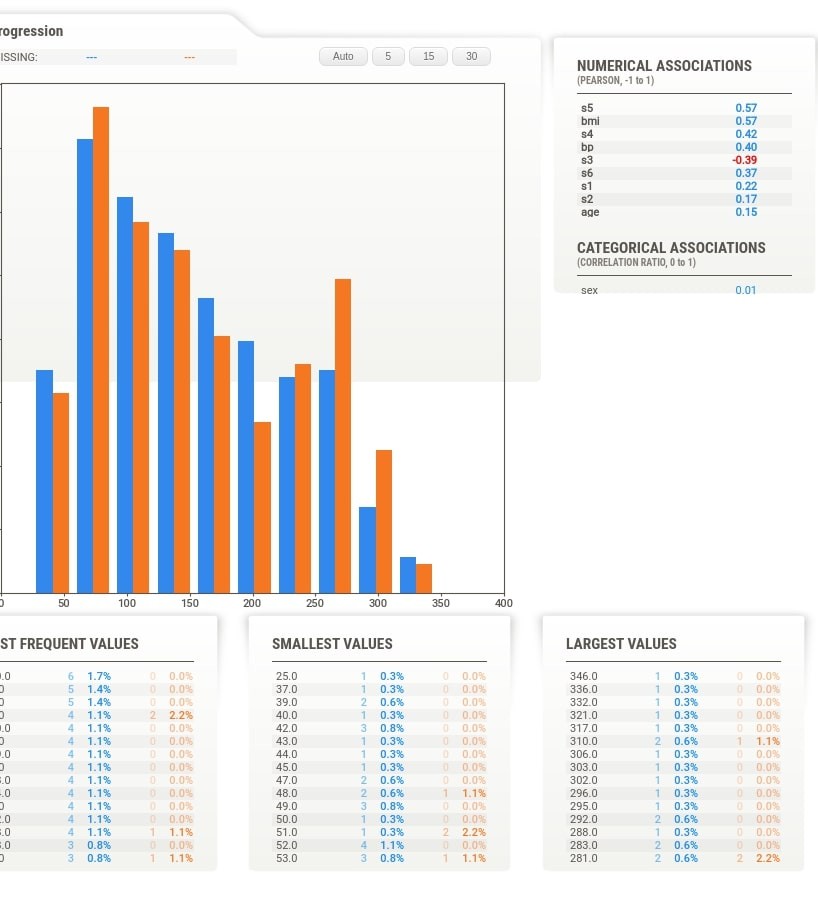
More Stats and Relation with Different Columns
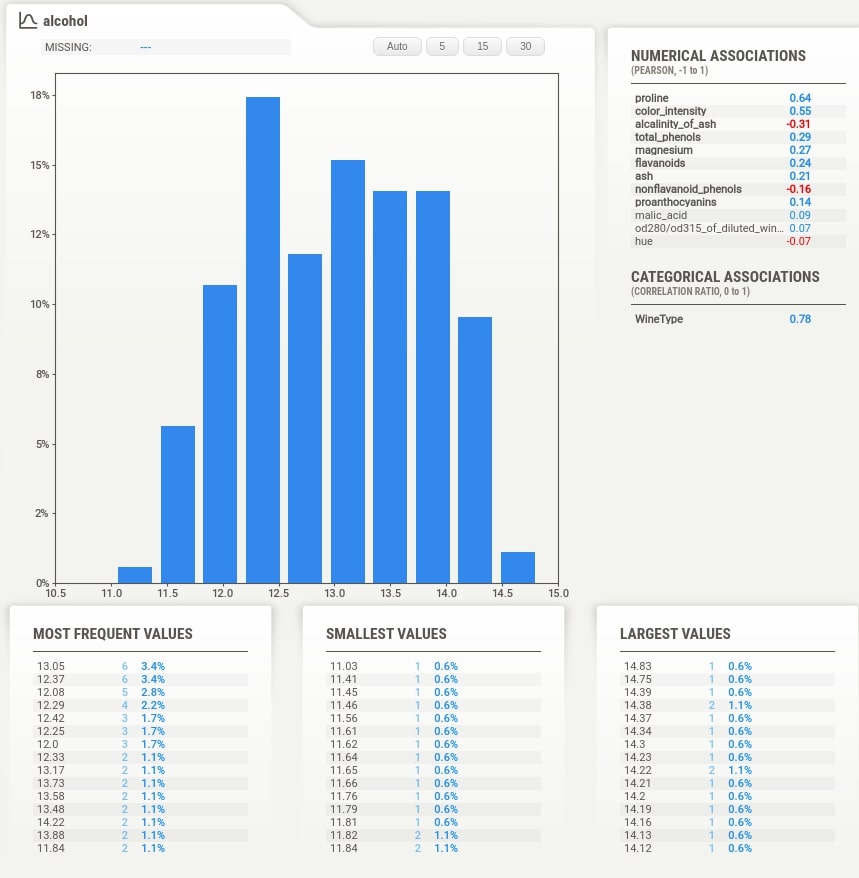
The tab which gets displayed when we click on the feature tab below the summary section has information like actual values of numerical and categorical associations of feature with all other features, few frequent values, few largest values, and few smallest values. It also shows the histogram of feature data distribution again.
The sweetviz also let us show reports inside of jupyter notebook using show_notebook() method which we had explained earlier. Below we have displayed the report inside of the jupyter notebook. We have provided a height parameter with the value of 1500 pixels to increase the height of the report displayed.
report.show_notebook(h=1500)
2. Target Variable Analysis 
As a part of this section, we'll explain how we can use sweetviz to perform target variable analysis which can be useful to see the relationship between the target variable and all features of the dataset. We can do so by just providing a column name from the dataframe that we want to use as the target variable in analyze() method.
Below we have generated a report from our diabetes dataframe using analyze() method. We have instructed the method to use Progression column as the target variable.
report = sweetviz.analyze([diabetes_df, "Diabetes Dataset"], target_feat="Progression")
After generating report, we have called show_html() method on DataframeReport object to open it in a browser.
report.show_html()
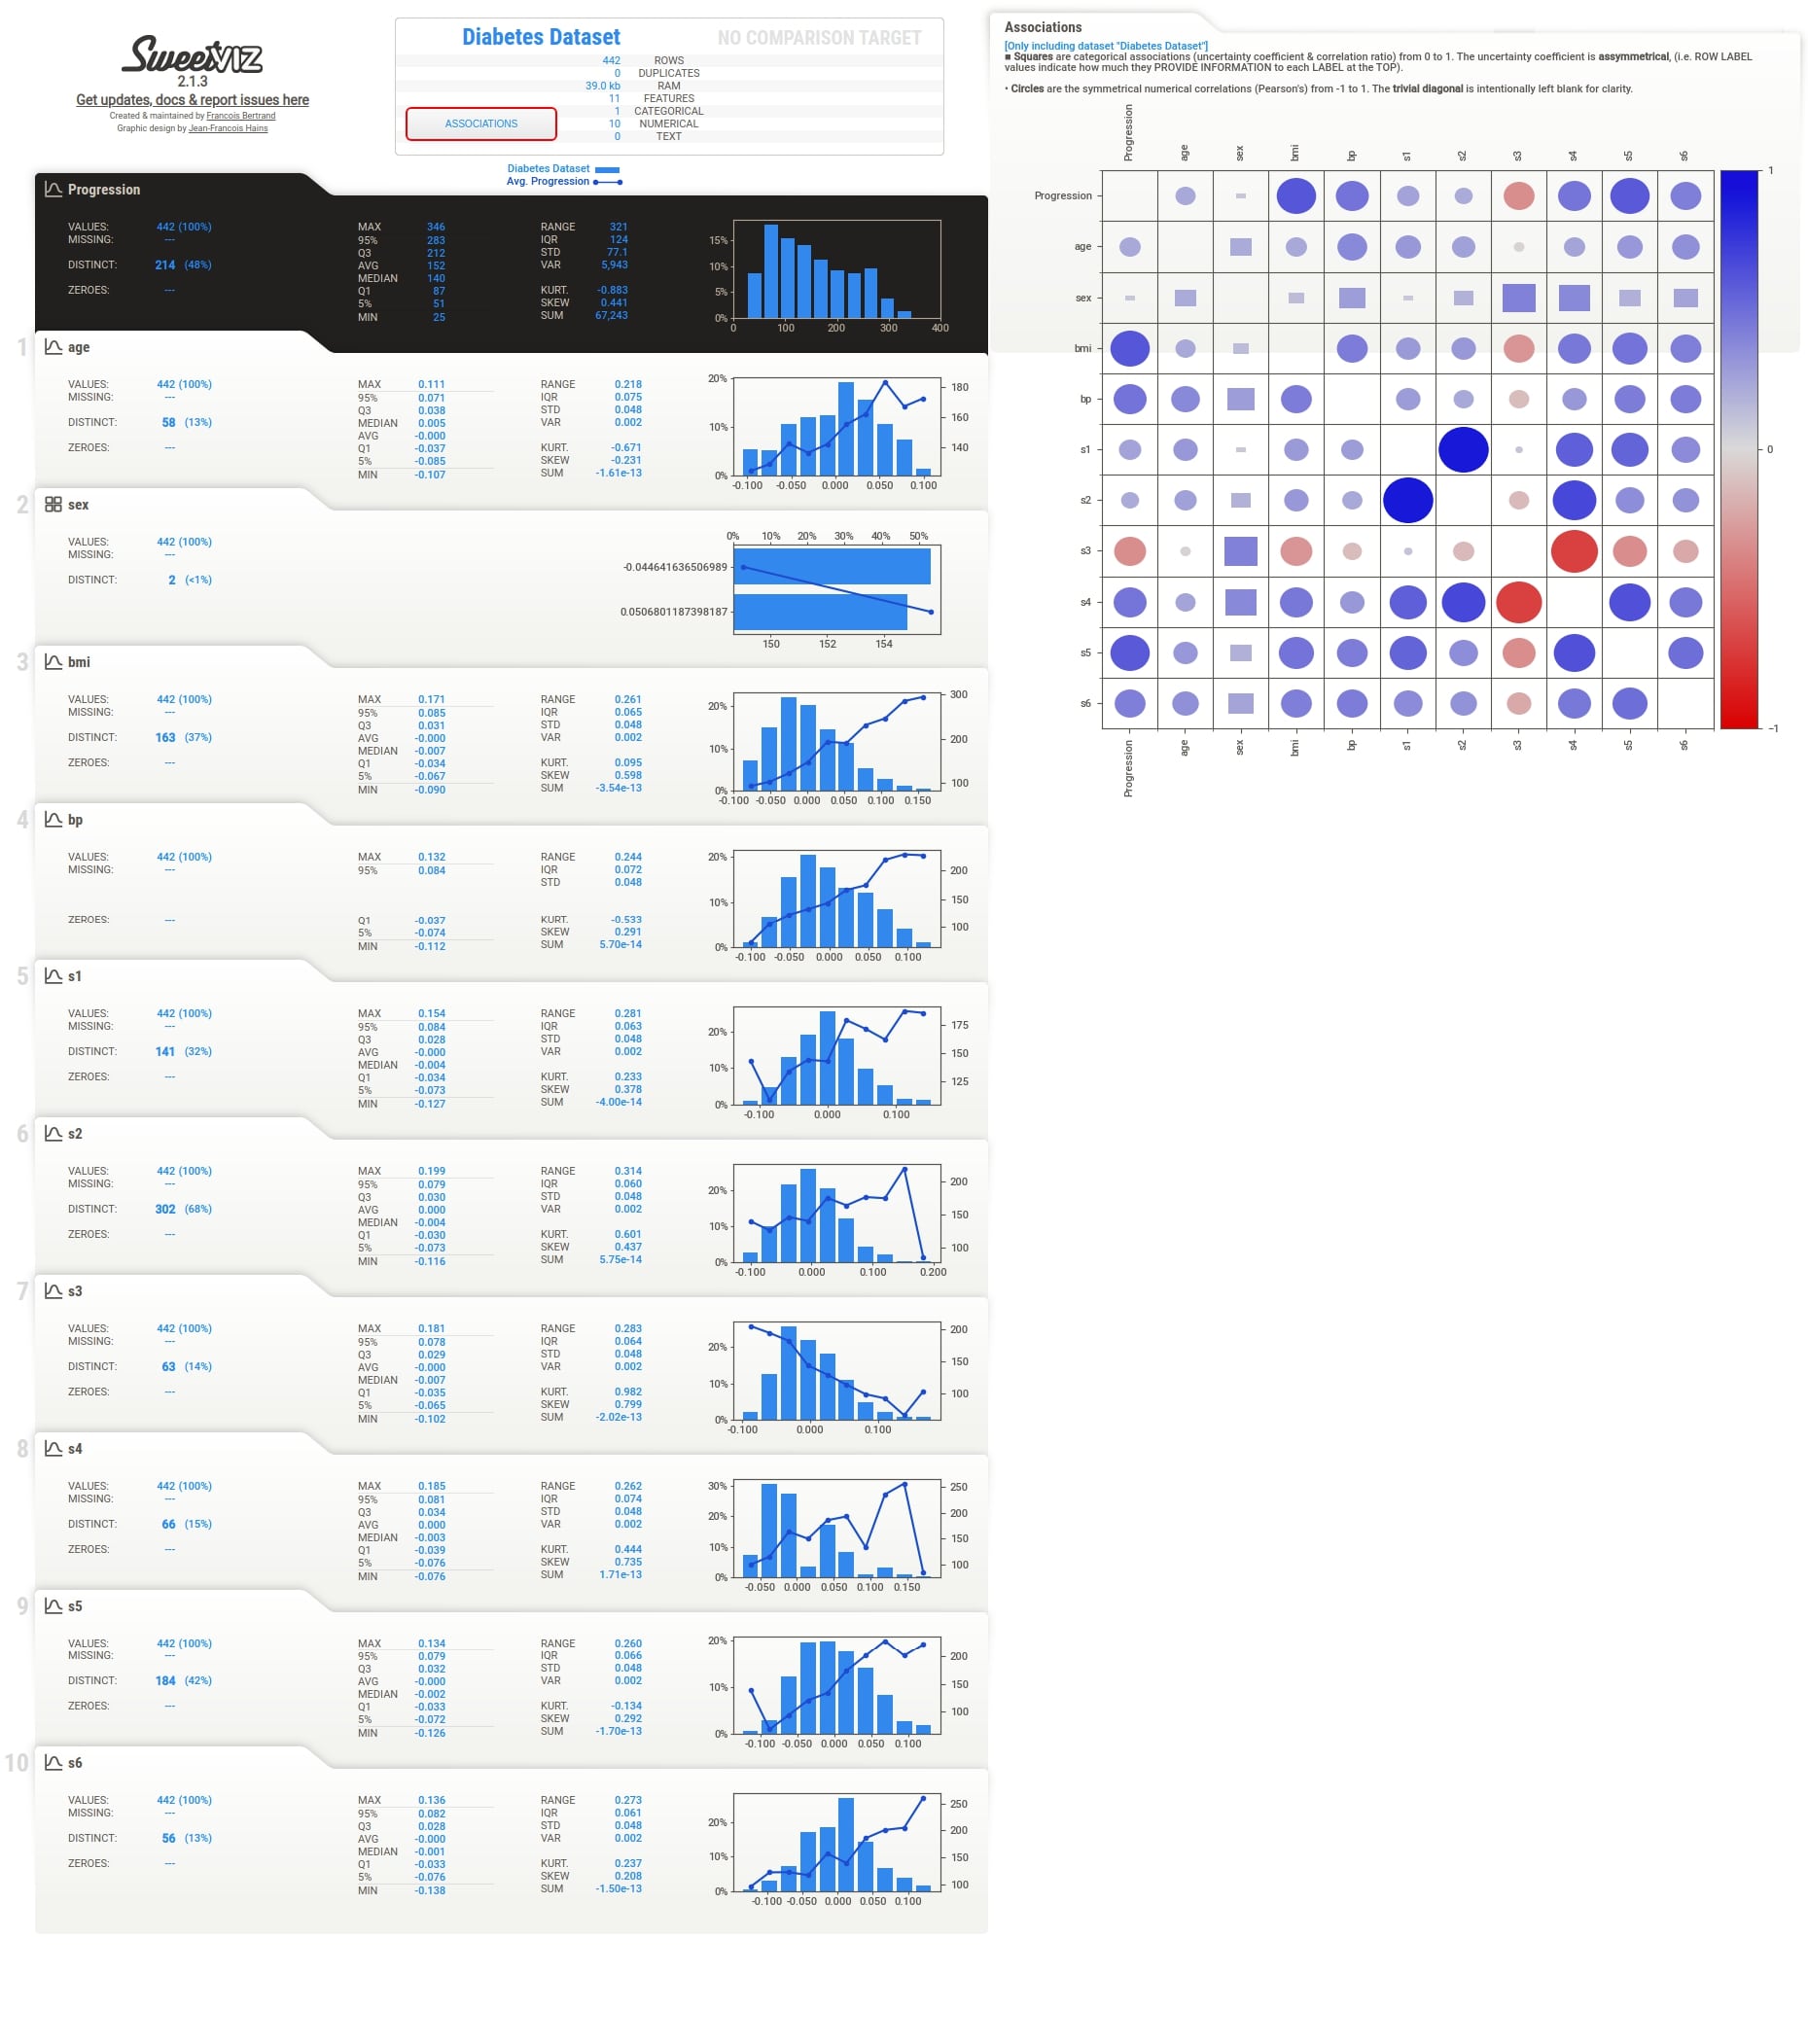
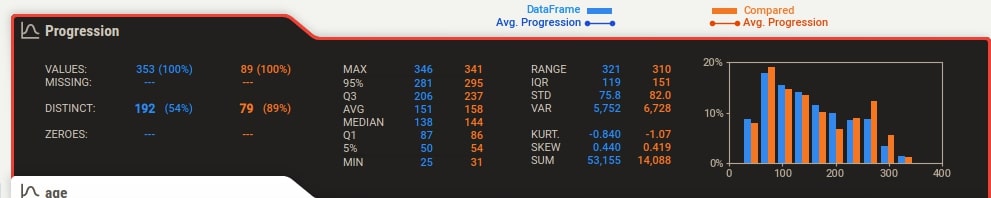
Target Variable Details
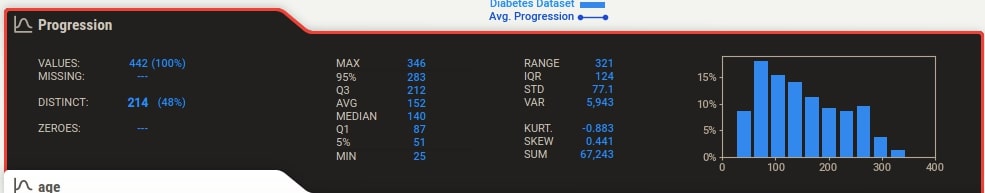
We can notice from the output that how the target variable tab is highlighted with black color to differentiate it from other columns.
Apart from this, the target variable values are also plotted as a line inside of histogram of the feature. This can be helpful to understand the relationship between the target variable and feature based on feature values. The value of the target variable is represented by Y-axis drawn on the right. When we click on the tab of any feature, we also see that association of that feature with the target variable is highlighted with black color.
Below we have generated another example of target variable analysis but this time we have used the wine dataset. We have skipped columns proline and magnesium from original dataset and instructed to use WineType column as numerical using FeatureConfig constructor. We can provide configuration for features of the dataset using this constructor. We can explicitly inform the features that we want to exclude from the report, we want to be considered categorical, numerical, or text. The skip parameter accepts a list of column names to skip from the report. The force_cat, force_text, and force_num accept a list of column names that we want to be considered as categorical, text, and numerical respectively.
config = sweetviz.FeatureConfig(skip=["proline", "magnesium"], force_num=['WineType'])
report = sweetviz.analyze(source=wine_df, feat_cfg=config, target_feat="WineType")
Below we have displayed the report generated for the wine dataset by providing WineType as the target variable.
report.show_html()
Below we have created another example showing usage of analyze() method. We have generated a report for the wine dataset. But this time, we have informed the method not to include pairwise relationships between features. This will not include associations details which we used to include in all reports till now.
report = sweetviz.analyze(source=wine_df, pairwise_analysis="off")
report.show_html()
3. Compare Two Datasets 
As a part of this section, we'll explain how we can compare two datasets and generate EDA for both. This will help us better understand the distribution of data between two datasets. We can compare train/test, train/validation, test/test and validation/test datasets.
Sweetviz let us generate EDA for two datasets using compare()* method. It'll show EDA for datasets next to each other.
We have first divided our diabetes dataset into train (80%) and test (20%) sets using scikit-learn's train_test_split() method. We'll be comparing these two datasets.
train_df, test_df = train_test_split(diabetes_df, train_size=0.8)

train_df.shape, test_df.shape
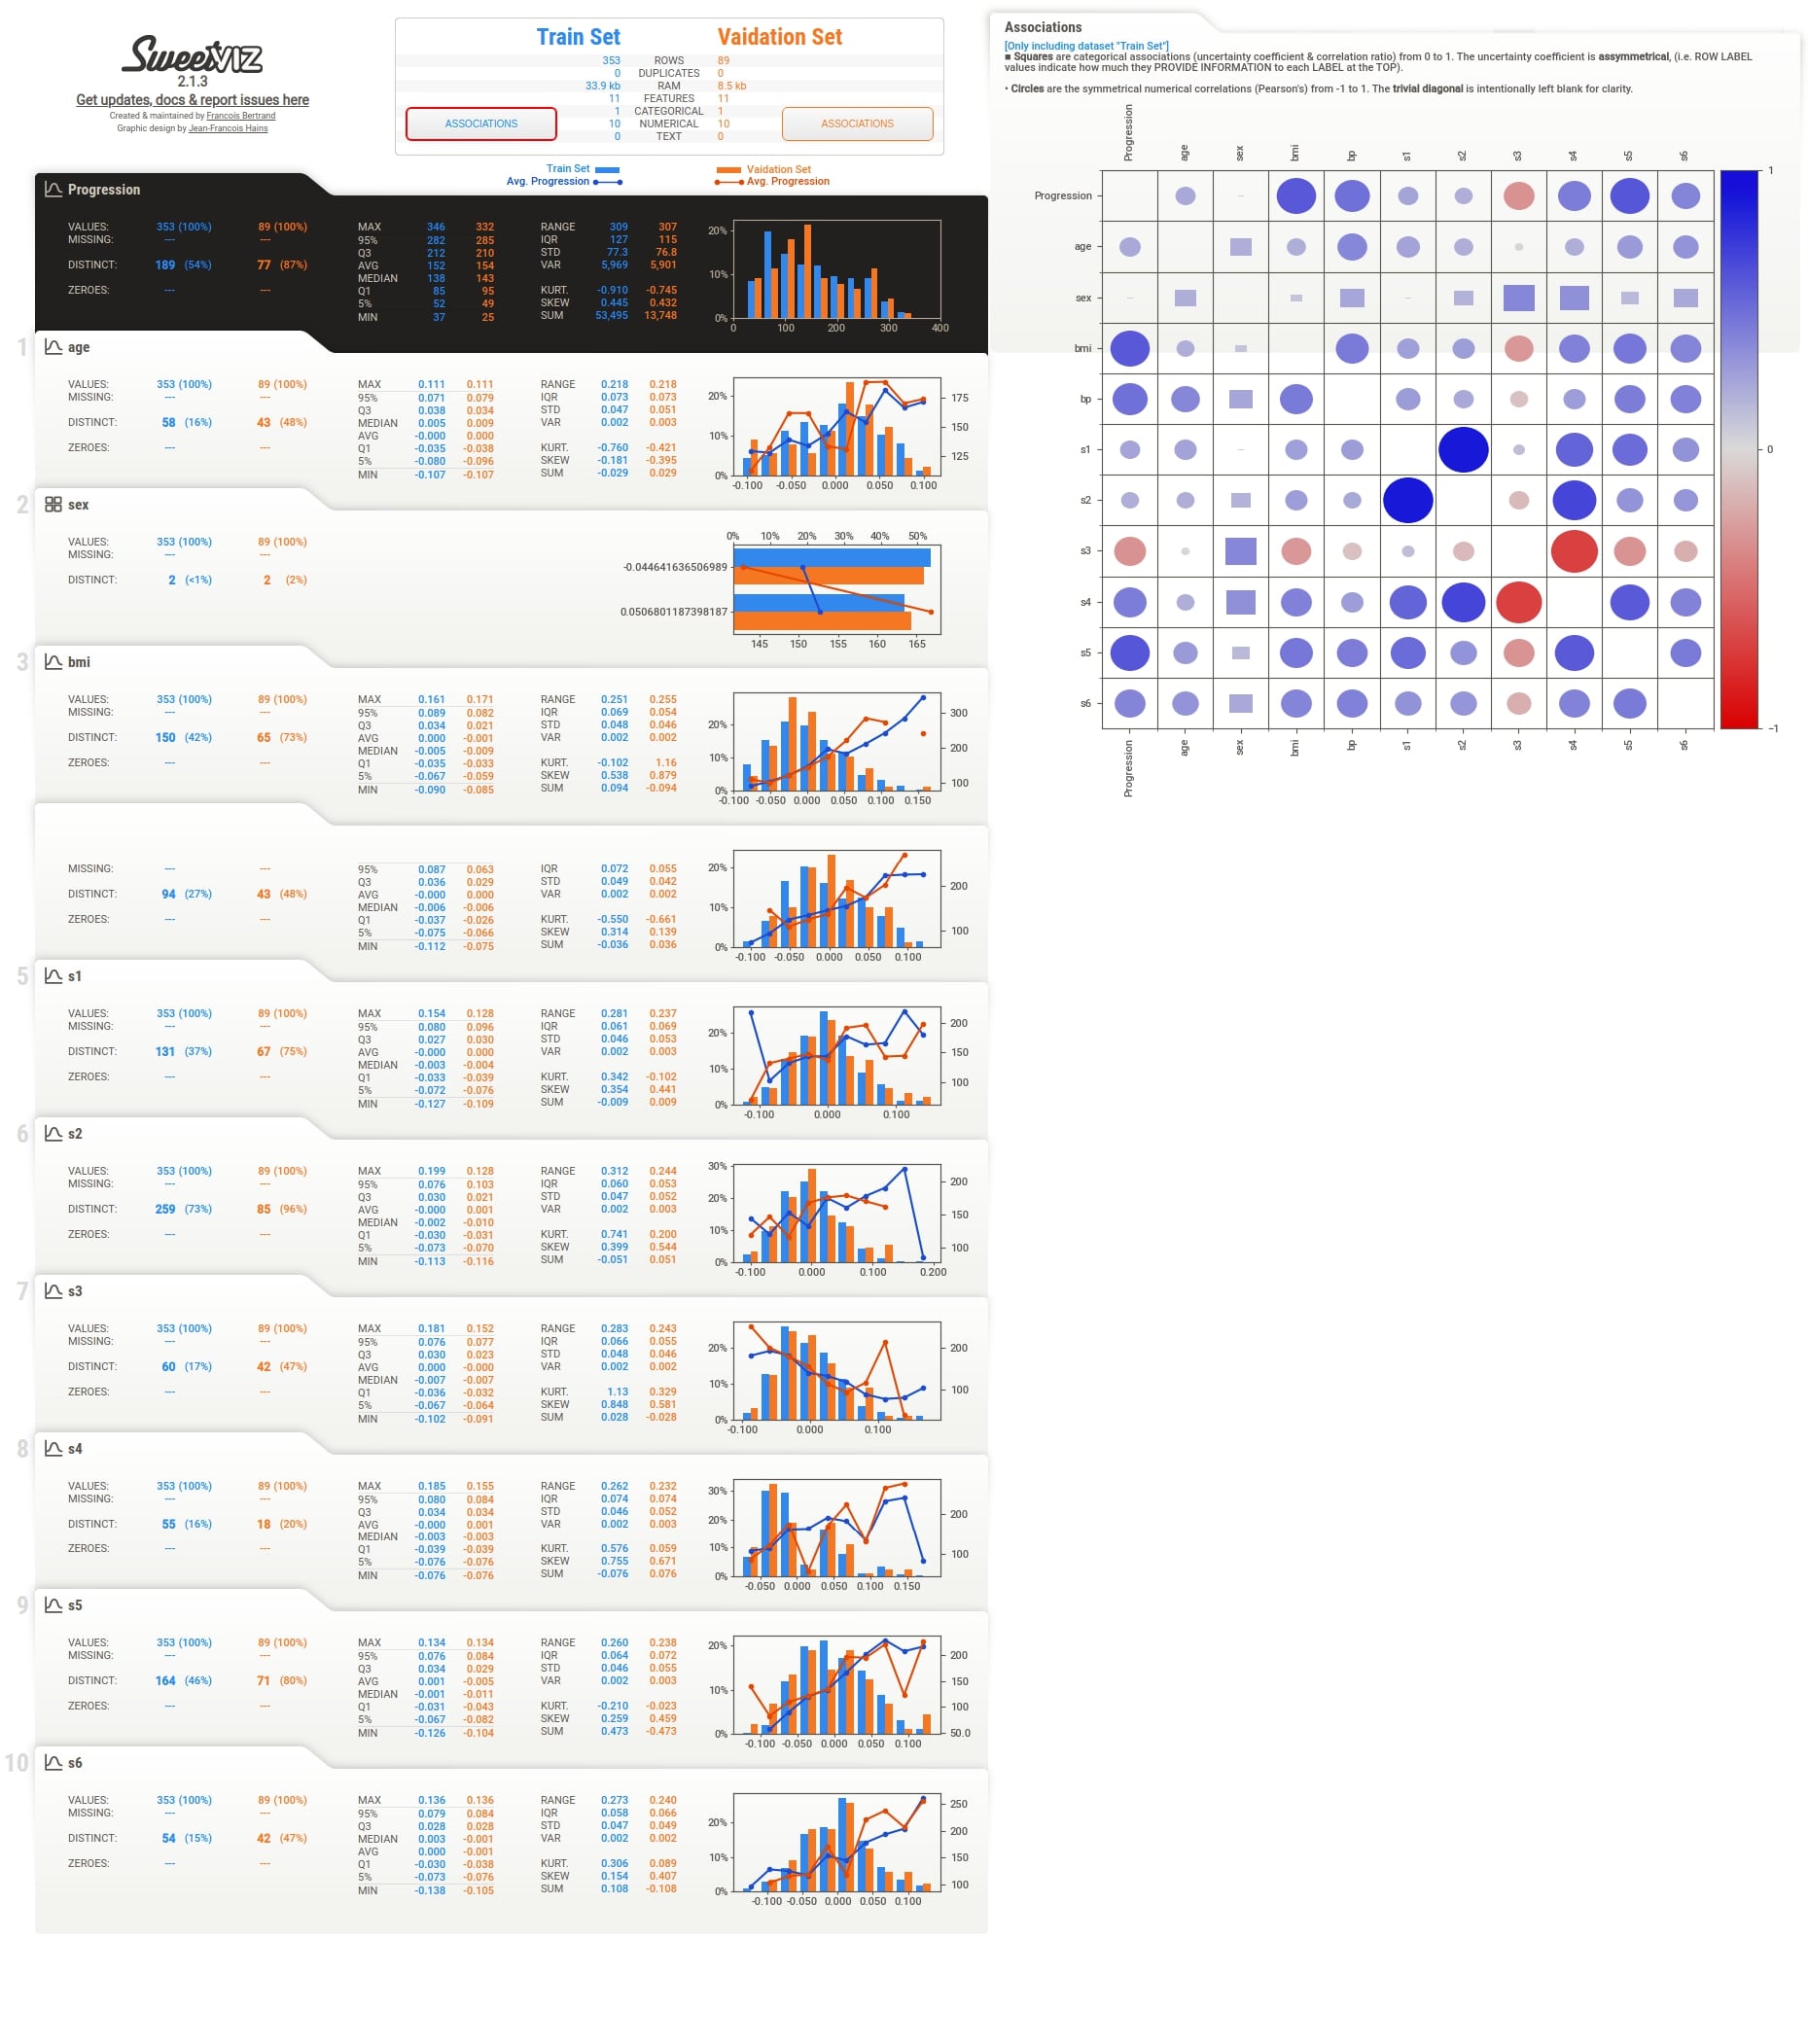
Below we have generated an EDA report comparing train and test datasets generated from the diabetes dataset. We have informed the method to use Progression column as the target variable. We have then called show_html() on the report to open it in a new window of the browser.
report = sweetviz.compare(source=train_df, compare=test_df, target_feat="Progression")
report.show_html()
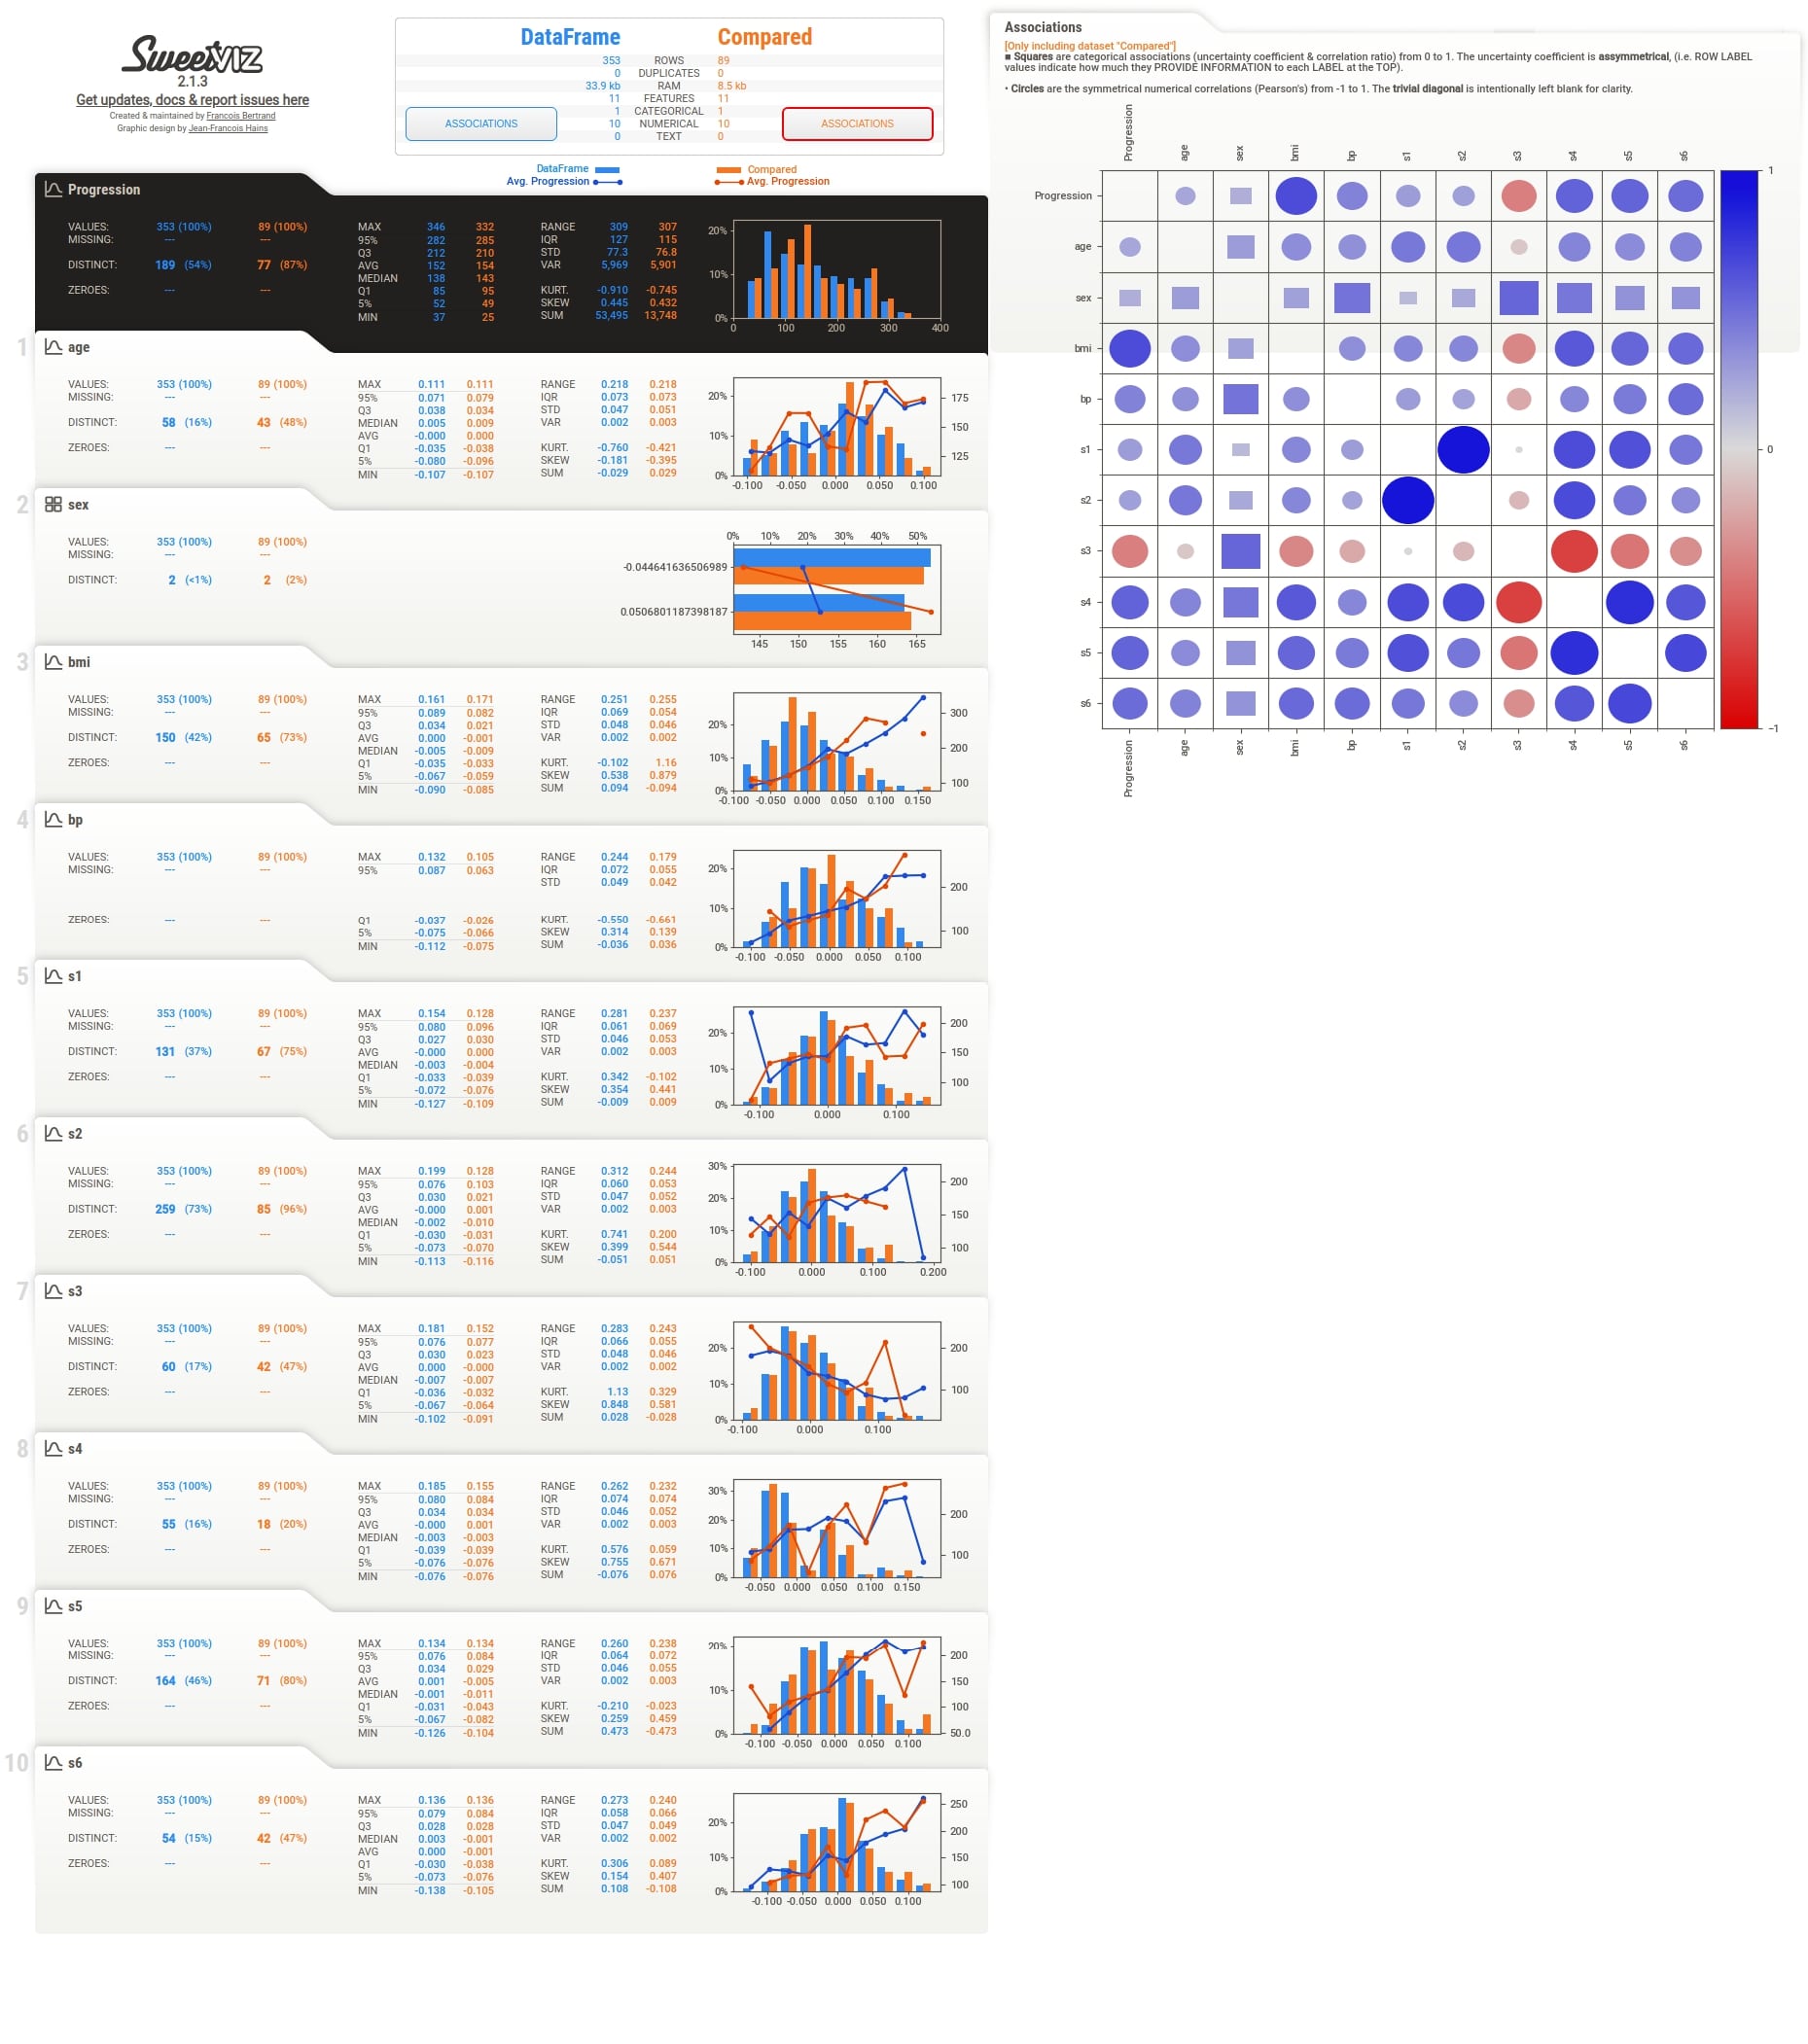
We can notice above from the full EDA report image that it shows details for both datasets.
Below we have included images for individual sections as well to give an idea about report sections.
Summary
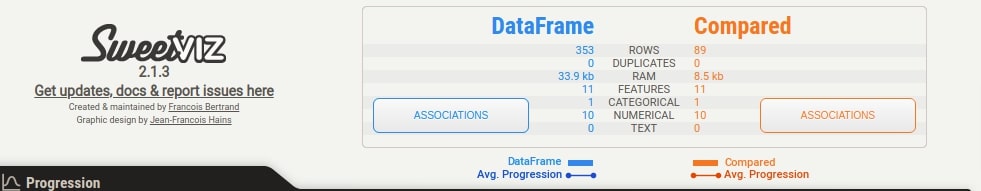
We can notice that the summary section now has summary details for both datasets. There are two Associations button which shows associations heatmap for both datasets when clicked.
Associations (Test Set)
Individual Column Stats
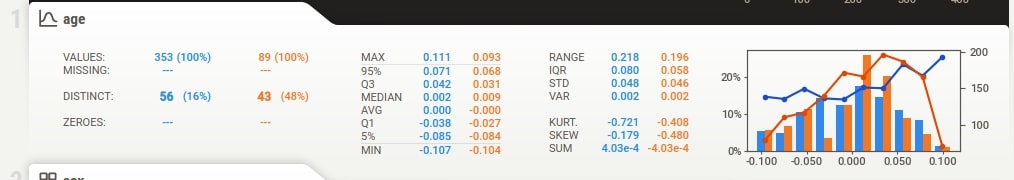
Individual column stats have now statistics for both datasets given as input. They are highlighted using different colors. The histogram of distribution is also generated for both datasets in a single chart with different colors. There are two lines in the histogram based on target variable values in each dataset.
More Stats and Relation with Different Columns
Target Variable Details
Below we have again generated a report using both datasets but this time we have given names for both datasets when generating a report using compare() method. Please check the report screenshot below to check the names appearing in the summary section.
report = sweetviz.compare(source=[train_df,"Train Set"], compare=[test_df, "Vaidation Set"],
                          target_feat="Progression")
report.show_html()
4. Divide Dataset using boolean variable and Compare them 
There are situations when we need to understand data distribution based on some boolean column of dataset like we want to see EDA for all rows with gender male v/s all rows with gender female. We can do this kind of comparison EDA using compare_intra() method. It'll generate results that are almost identical to that generated by compare() method.
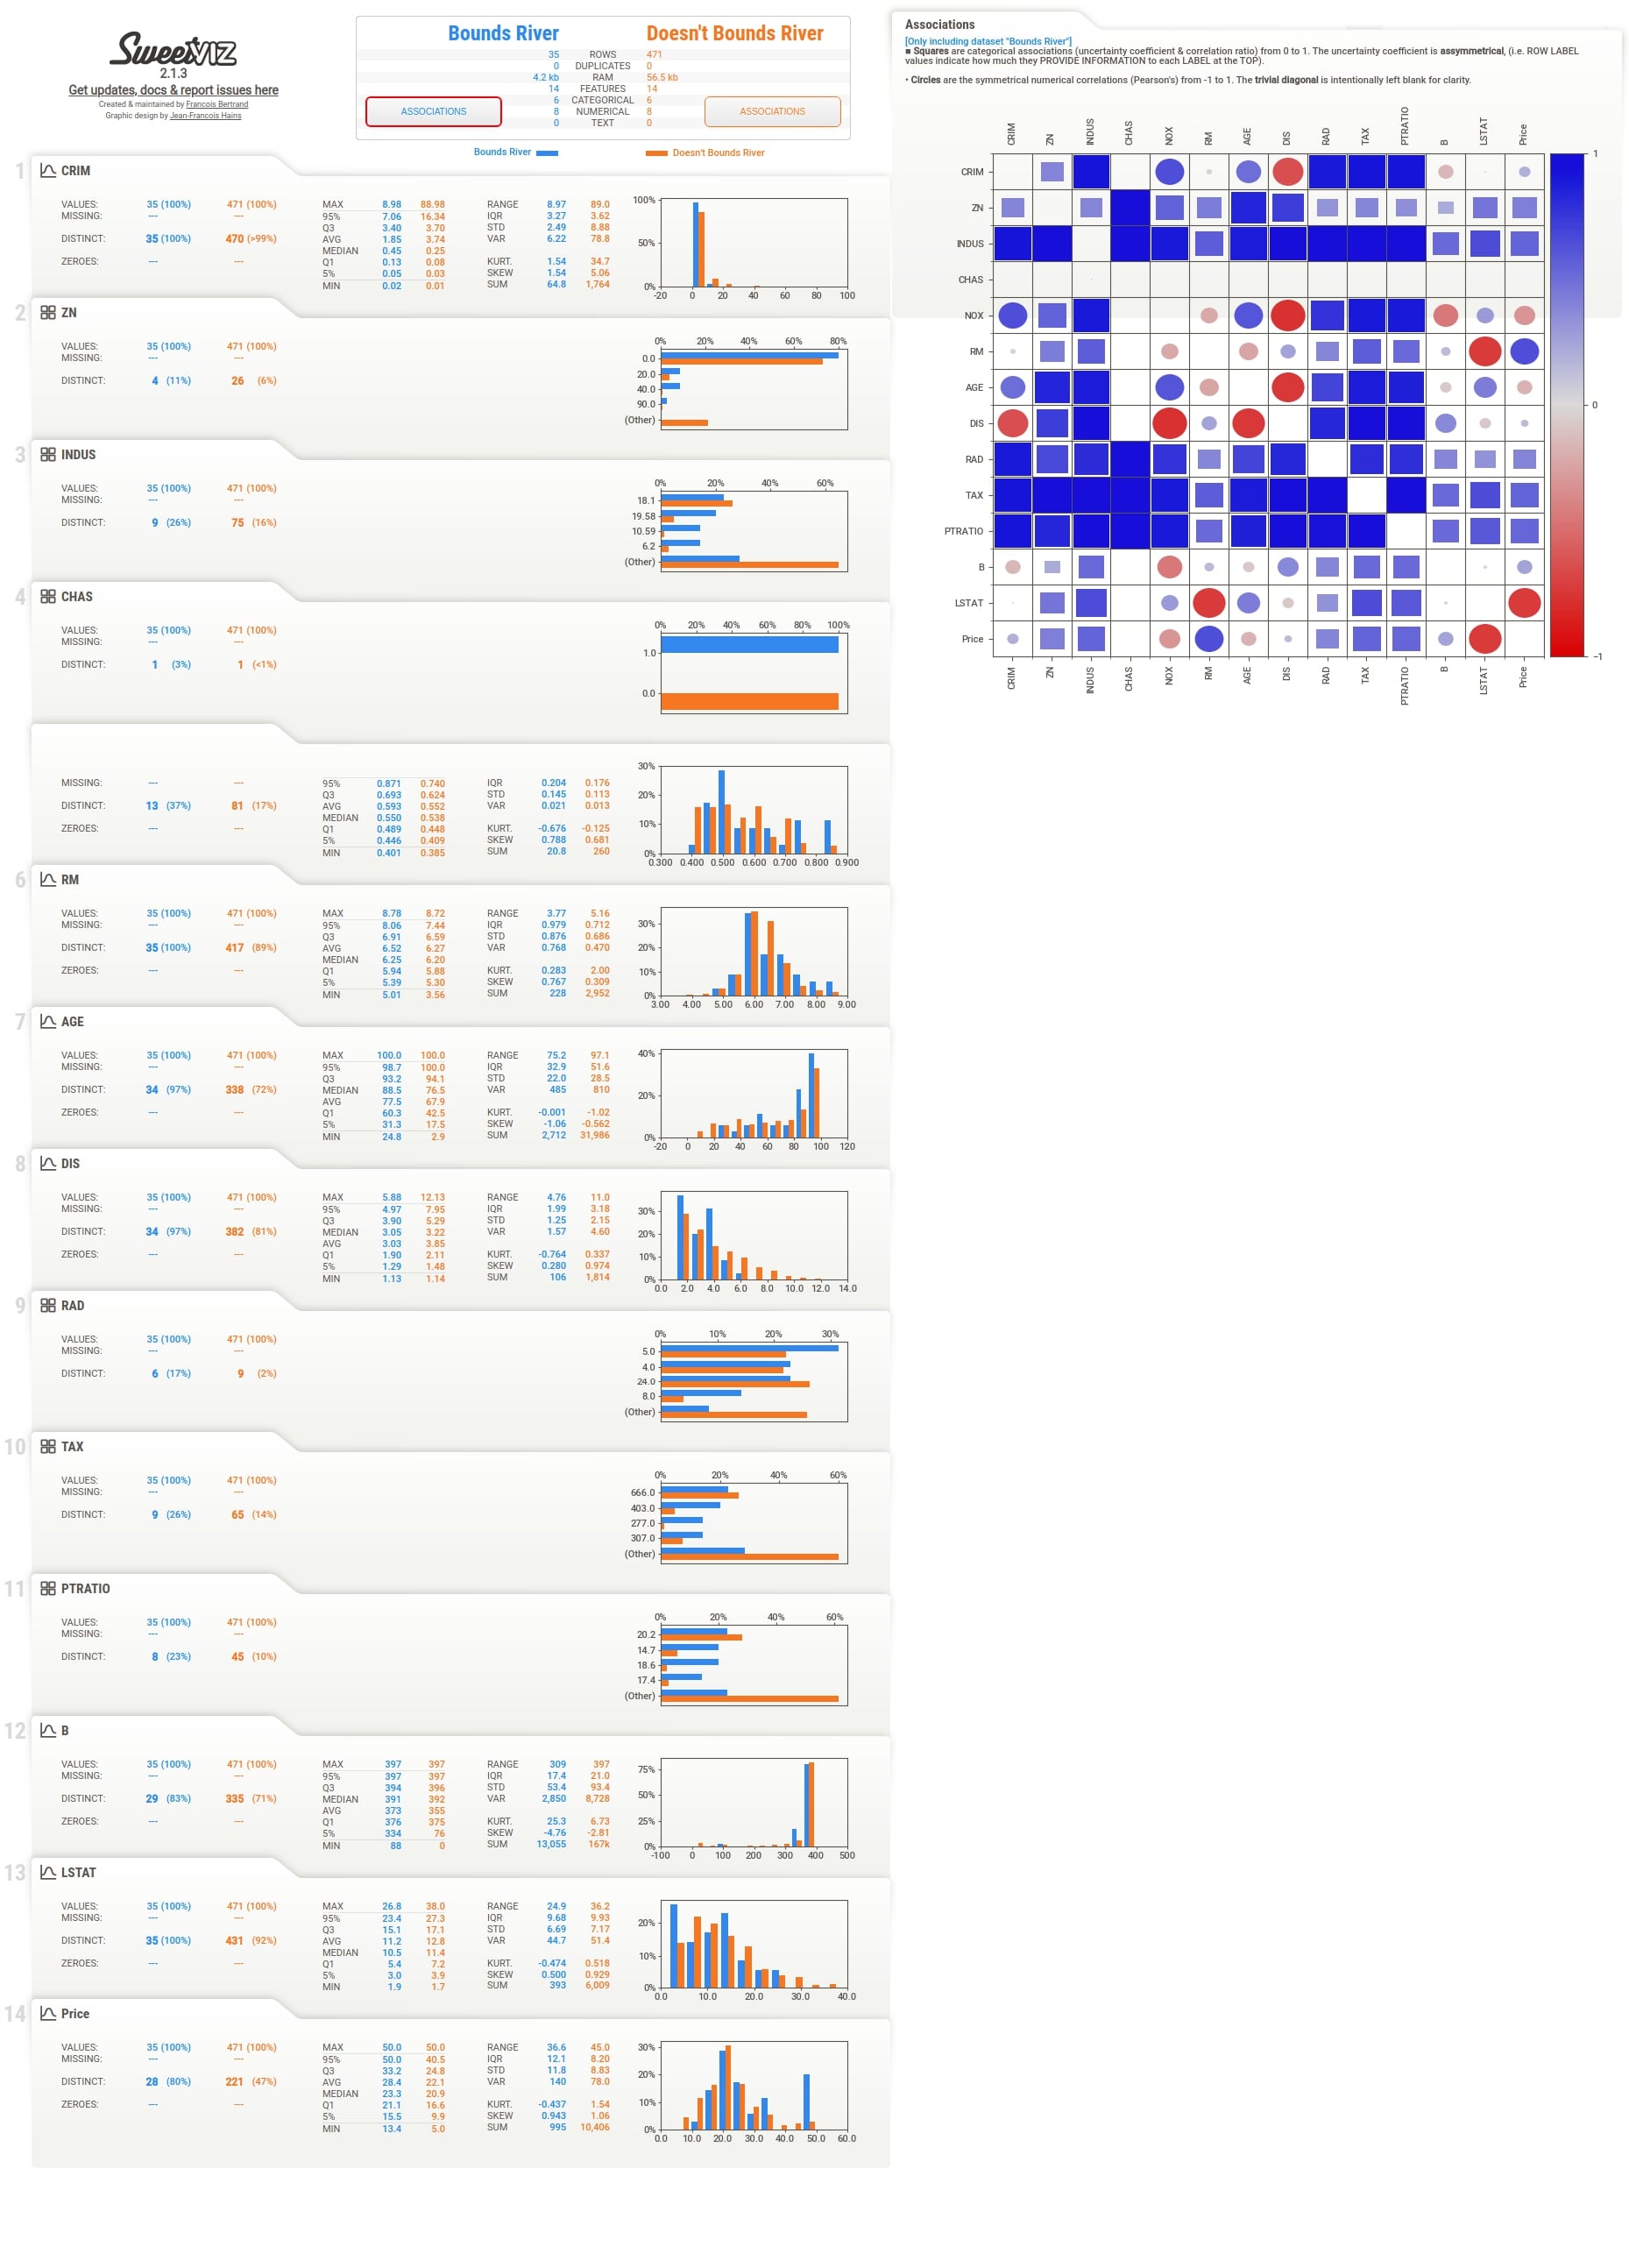
We'll be using our Boston housing dataset to generate the report using compare_intra() method. We have provided values of column CHAS as boolean values to condition_series parameter of the method to inform it to divide dataset based on these boolean values and then generate EDA report. The CHAS variable inside of the Boston hosing dataset has boolean information about whether houses are on the bounds of a river or not. The compare_intra() method will divide the Boston dataset into two datasets based on boolean values of column CHAS and generate EDA comparing those two datasets.
We have also included a screenshot of the report generated below by calling show_html() method on the report.
report = sweetviz.compare_intra(source_df=boston_df,
                                condition_series=boston_df["CHAS"].astype(bool),
                                names=["Bounds River","Doesn't Bounds River"])
report.show_html()
5. Analysis Directly using DataFrameReport Object 
All the three methods that we explained earlier generates a report and return an instance of type DataframeReport which we can display by calling report_html() method on it. We can also directly create an instance of DataframeReport with datasets and it'll just work fine.
Below we have created a report of the wine dataset by creating an instance of DataframeReport using constructor. We can then call show_html() method on it and it'll open the report in a new browser tab.
report = sweetviz.DataframeReport(source=wine_df)
Below we have explained another example where we provide train and test sets generated earlier from the diabetes dataset.
report = sweetviz.DataframeReport(source=train_df, compare=test_df, target_feature_name="Progression")
This ends our small tutorial explaining how to use sweetviz library. Please feel free to let us know your views in the comments section.
Reference
 Sunny Solanki
Sunny Solanki
Intro: Software Developer | Youtuber | Bonsai Enthusiast
About: Sunny Solanki holds a bachelor's degree in Information Technology (2006-2010) from L.D. College of Engineering. Post completion of his graduation, he has 8.5+ years of experience (2011-2019) in the IT Industry (TCS). His IT experience involves working on Python & Java Projects with US/Canada banking clients. Since 2020, he’s primarily concentrating on growing CoderzColumn.
His main areas of interest are AI, Machine Learning, Data Visualization, and Concurrent Programming. He has good hands-on with Python and its ecosystem libraries.
Apart from his tech life, he prefers reading biographies and autobiographies. And yes, he spends his leisure time taking care of his plants and a few pre-Bonsai trees.
Contact: sunny.2309@yahoo.in


![YouTube Subscribe]() Comfortable Learning through Video Tutorials?
Comfortable Learning through Video Tutorials?
If you are more comfortable learning through video tutorials then we would recommend that you subscribe to our YouTube channel.
![Need Help]() Stuck Somewhere? Need Help with Coding? Have Doubts About the Topic/Code?
Stuck Somewhere? Need Help with Coding? Have Doubts About the Topic/Code?
 Stuck Somewhere? Need Help with Coding? Have Doubts About the Topic/Code?
When going through coding examples, it's quite common to have doubts and errors.
If you have doubts about some code examples or are stuck somewhere when trying our code, send us an email at coderzcolumn07@gmail.com. We'll help you or point you in the direction where you can find a solution to your problem.
You can even send us a mail if you are trying something new and need guidance regarding coding. We'll try to respond as soon as possible.
![Share Views]() Want to Share Your Views? Have Any Suggestions?
Want to Share Your Views? Have Any Suggestions?
 Want to Share Your Views? Have Any Suggestions?
If you want to
- provide some suggestions on topic
- share your views
- include some details in tutorial
- suggest some new topics on which we should create tutorials/blogs
 sweetviz, EDA